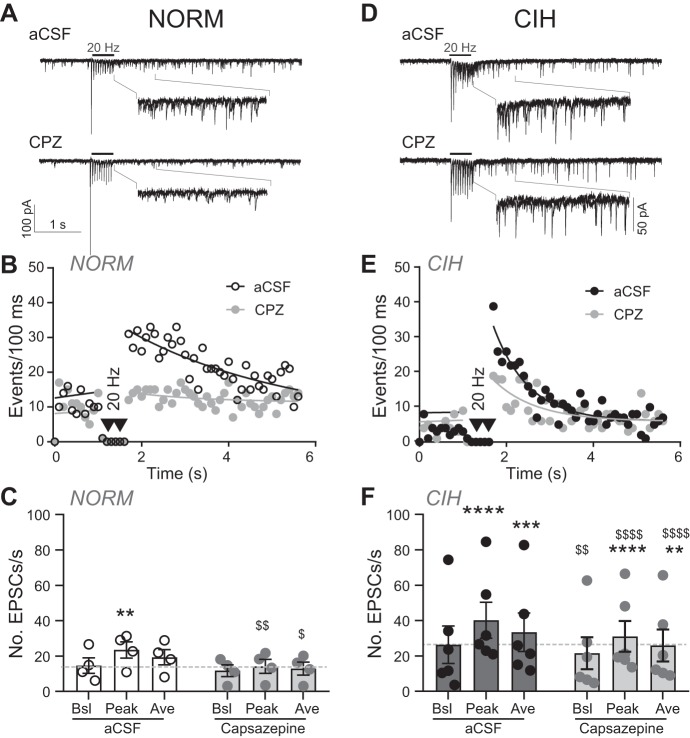
Fig. 5.
TRPV1 inhibitor capsazepine (CPZ) reduces the increase in spontaneous activity in chronic intermittent hypoxia (CIH)-exposed rats. A: example of excitatory postsynaptic currents (EPSCs) from normoxic (NORM) rats during artificial cerebrospinal fluid (aCSF) control (top) and following TRPV1 inhibition (bottom) with CPZ (10 µM). Note the decrease in asynchronous EPSC events after TRPV1 inhibition. Horizontal bars depict time of 20-Hz tractus solitarii (TS) stimulation. Examples are overlays of 2 traces each. Insets are zoomed images of peak events. B: diary of events of NORM cell in A before and after response to TS stimulation. C: group data for NORM (n = 4) shows CPZ depression of peak and average events compared with aCSF control following stimulation (2-way RM ANOVA: EPSC, P = 0.009; drug, P = 0.02; EPSC × drug, P = 0.08). D: EPSCs from CIH-exposed rat during aCSF control (top) and following TRPV1 inhibition (bottom) with CZP. Examples are overlays of 2 traces each. Insets are zoomed images of peak events. E: diary of events of CIH cell in D. F: group data for CIH-exposed cells (n = 6), showing TRPV1 inhibition with CPZ attenuated baseline, peak, and average events (2-way RM ANOVA: EPSC, P = 0.0005; drug, P = 0.01; EPSC × drug, P = 0.03). In B and E, events before TS stimulation are fit with a linear regression, whereas events following TS stimulation are fit via nonlinear curve; data are plotted as events per 100 ms. In C and F, dashed lines indicates aCSF baseline events. Ave, average; Bsl, baseline. **P < 0.01; ***P < 0.001; ****P < 0.0001, peak or average vs. baseline (pre TS-stimulation) with Bonferroni multiple comparison. $P < 0.05; $$P < 0.01; $$$$P < 0.0001, CPZ vs. aCSF control with Bonferroni multiple comparison.

