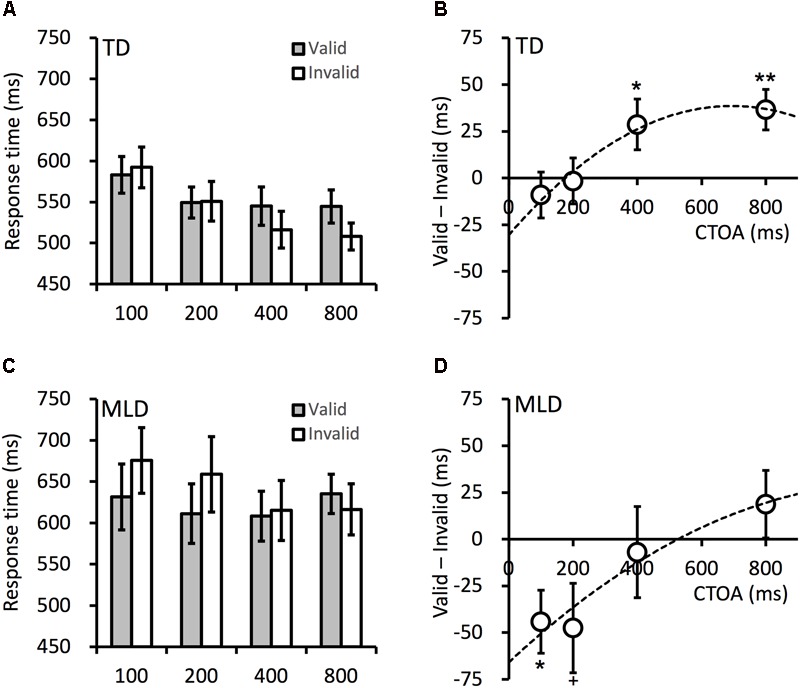
FIGURE 2.

Mean target RTs in the TD (A) and MLD (C) children. The cueing effects in the TD (B) and MLD (D) children. CTOA is the time interval (in milliseconds) between cue onset and target onset (see Figure 1 for an illustration). Dashed lines are polynomial fittings of the cueing effects against CTOA. Error bars denote ± 1 SEM. +p < 0.06, ∗p < 0.05, ∗∗p < 0.01.
