Figure 4.
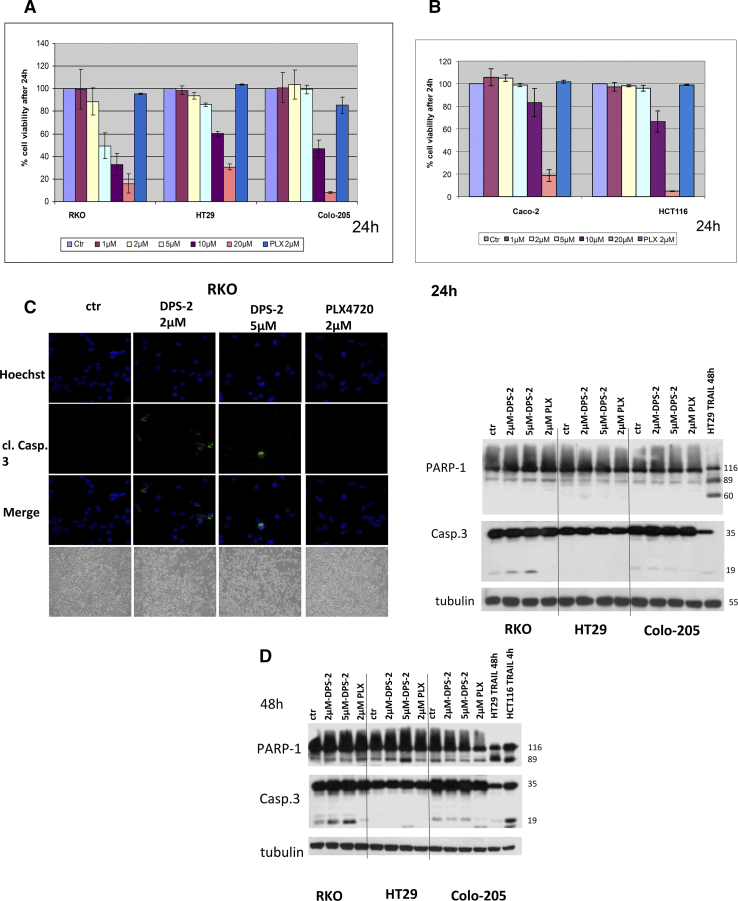
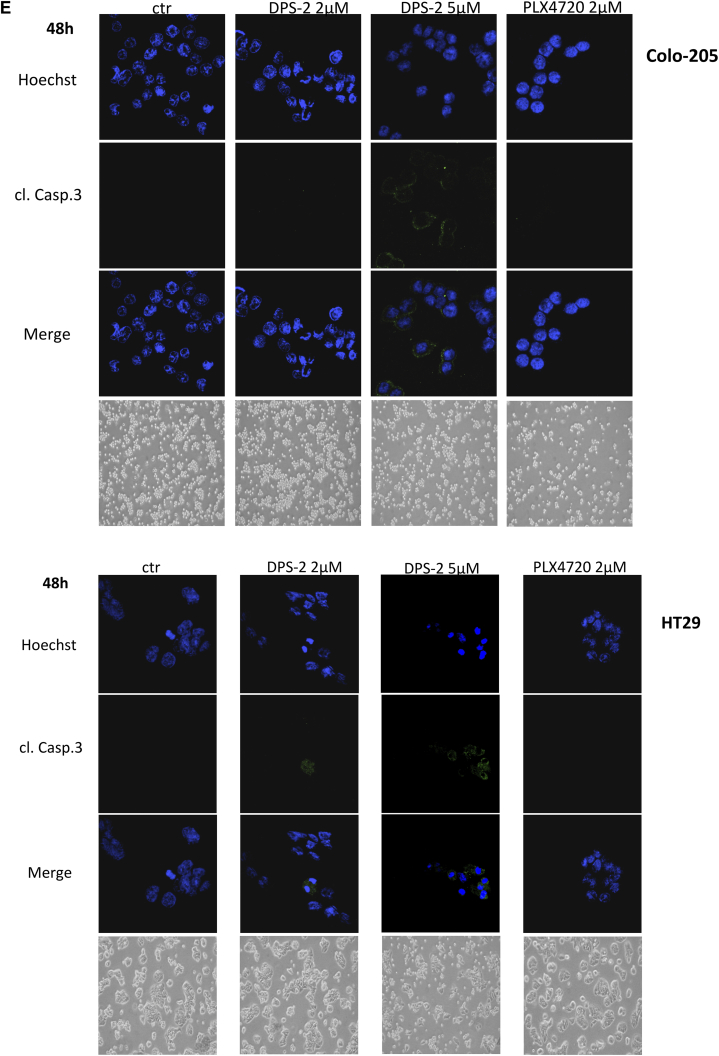
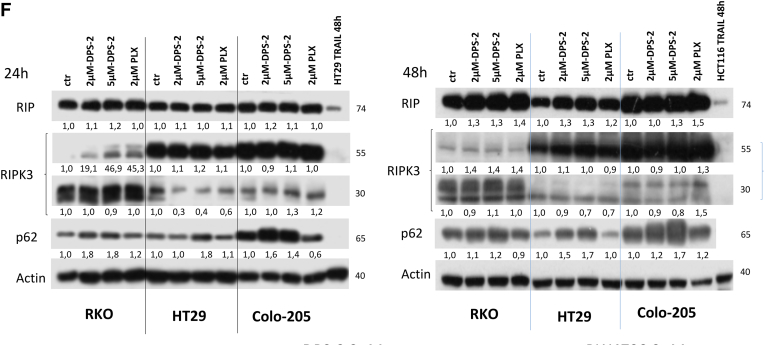
DPS-2 induces apoptosis and reduces autophagy in cancer cells lines.
(A, B) Cell viability in RKO, HT29, Colo-205, Caco-2, HCT116, and DLD-1 cell lines were measured, using the SRB assay, after 24-hour treatment with increasing concentrations of DPS-2 inhibitor. Data are representative for two independent experiments, each of which was performed in duplicates. SD was used for error bar generation. (C, left panel) Light and confocal microscope images of 2D culture in RKO cell line after treatment with 2 μΜ and 5 μΜ of DPS-2 for 24 hours. For apoptotic marker staining, cells were incubated and stained with Hoechst (first line) and with cleaved Caspase 3 antibody (second line) and merged (third column) in order to detect the presence of apoptotic cell death due to treatment (second, third row), as compared to untreated control (first row). Cells were also visualized under light microscope (fourth row). PLX4720 was used as a negative control for apoptosis. (Right panel) Western blot analysis of protein levels of the apoptotic markers PARP-1 and Caspase-3 after 24-hour treatment with 2 μΜ and 5 μΜ of DPS-2 in RKO, HT29, and Colo-205 cell lines. Protein levels were normalized against tubulin. TRAIL was used as a positive control for the presence of apoptotic cell death. PLX4720 was used as a negative control for apoptosis. Data are representative for three independent experiments. (D) Western blot analysis of protein levels of the apoptotic markers PARP-1 and Caspase-3 after 48-hour treatment with 2 μΜ and of DPS-2 in RKO, HT29, and Colo-205 cell lines. Protein levels were normalized against tubulin. (E) Light and confocal microscope images of 2D culture in HT29 and Colo-205 cell lines after treatment with 2 μΜ and 5 μΜ of DPS-2 for 48 hours. For apoptotic marker staining, cells were incubated and stained with Hoechst (first line) and with cleaved Caspase 3 antibody (second line) and merged (third line) in order to detect the presence of apoptotic cell death due to treatment (second, thi3rd column), as compared to untreated control (first row). Cells were also visualized under light microscope (fourth column). PLX4720 was used as a negative control for apoptosis. (F) Western blot analysis of protein levels of the necroptotic markers RIP-1 (RIP) and RIP-3 (RIPK3) and the autophagic marker p62 after 24 hours (left panel) and 48 hours (right panel) of treatment with 2 μΜ and 5 μΜ of DPS-2 in RKO, HT29, and Colo-205 cell lines. Protein levels were normalized against actin.


