Figure 1.
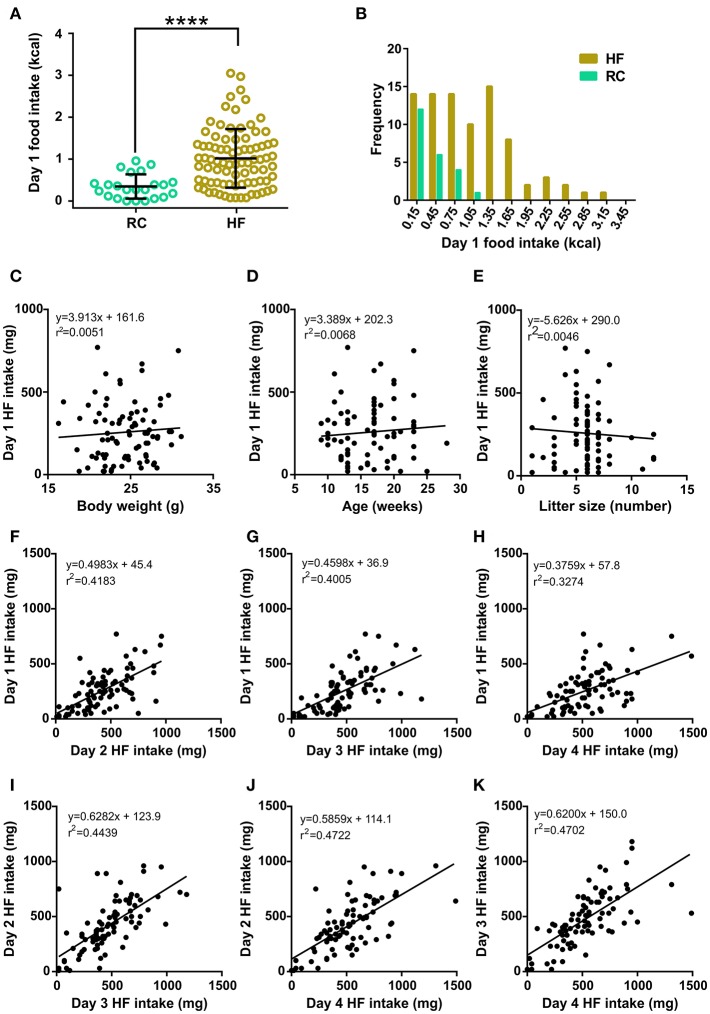
(A) Dot plot of the individual food intake values of RC (light green circles, n = 23) and HF (khaki circles, n = 84) groups. Lines represent the mean and SD of each group. ****p < 0.0001, Mann-Whitney test (U = 346.5). (B) Corresponding histograms of food intake for HF and RC mice. (C–E) Scatter plots of day 1 HF intake vs. body weight (C), age (D), and litter size (E). In each case, the linear regression between both parameters is shown, along with the corresponding equation and R squared. (F–K) Scatter plots of day 1 HF intake vs. day 2 HF intake (F), day 3 HF intake (G), and day 4 HF intake (H); day 2 HF intake vs. day 3 HF intake (I) and day 4 HF intake (J), and day 3 HF intake vs. day 4 HF intake (K). In each case, the linear regression between both parameters is shown with the corresponding equation and R squared. All linear regressions presented a slope significantly different from zero according to an F test [in (F): p < 0.0001, F = 58.96; in (G): p < 0.0001, F = 54.78; in (H): p < 0.0001, F = 39.91; in (I): p < 0.0001, F = 65.43; in (J): p < 0.0001, F = 73.37 and in (K): p < 0.0001, F = 72.77].

