Figure 3.
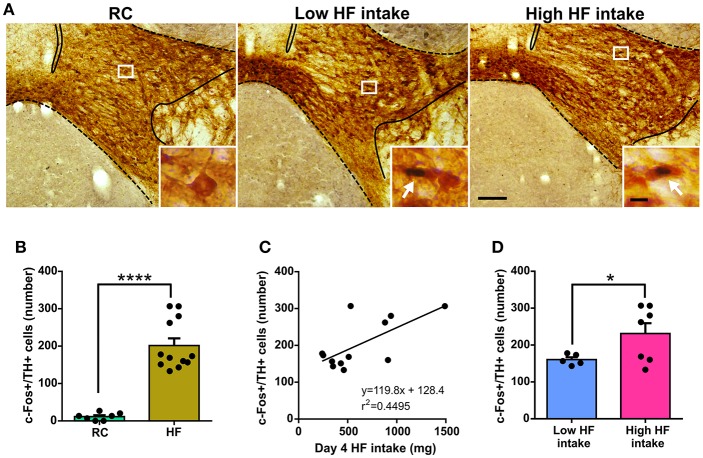
(A) Representative photomicrographs of the double c-Fos/TH immunostaining in the VTA of RC, Low HF intake and High HF intake groups. In each picture, the limits of the VTA are overlaid according to the delineation described in the Mouse Brain Atlas (10). Insets show, in high magnification, the areas delimited by rectangles in low magnification images. Arrows point at dual-labeled cells. Scale bars: 100 μm, low magnification and 10 μm, high magnification. (B) Quantitative analysis of the number of c-Fos+/TH+ cells in the VTA of RC and HF groups. Bars represent the mean ± SEM and dots represent the individual c-Fos+/TH+ values for each mouse. ****p < 0.0001, unpaired t-test with Welch's correction (t = 9.716, df = 11.83). (C) Scatter plot of c-Fos+/TH+ cells number vs. day 4 HF intake. The linear regression between both parameters is shown with the corresponding equation and R squared. The linear regression presented a slope significantly different from zero according to an F test (p = 0.0170, F = 8.166). (D) Quantitative analysis of the number of c-Fos+/TH+ cells in the VTA of low HF intake and high HF intake groups. Bars represent the mean ± SEM and dots represent the individual c-Fos+/TH+ values for each mouse. *p < 0.05, unpaired t-test with Welch's correction (t = 2.446, df = 6.639).

