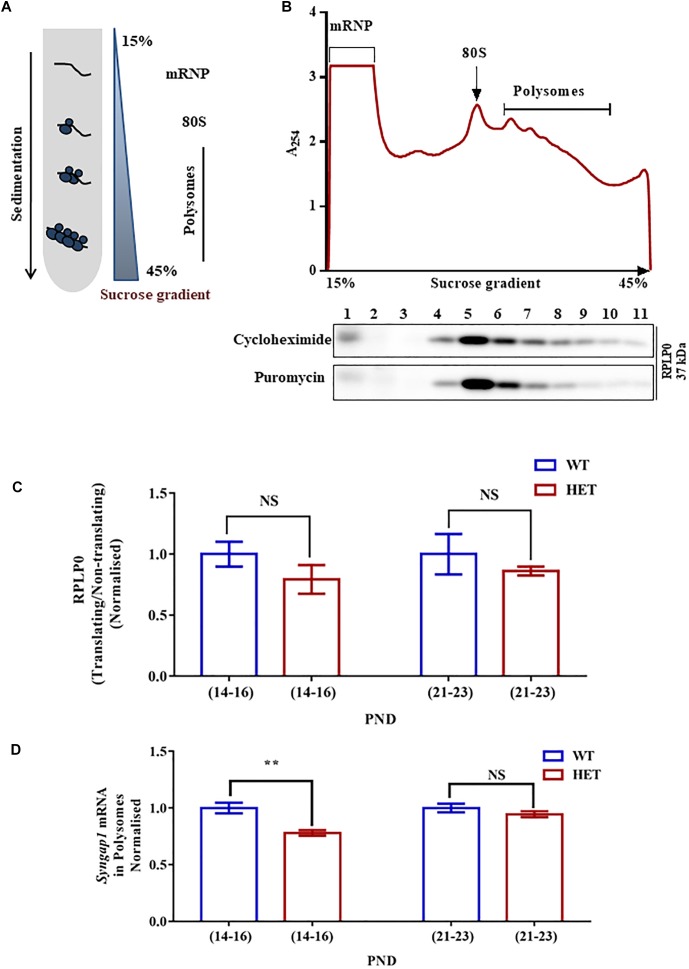
FIGURE 3.
Altered Syngap1 mRNA distribution in translating polysomal fractions of HET. (A) Schematic diagram depicting the sucrose gradient method used for polyribosome profiling (translation assay). (B) Polyribosome profile obtained from Cycloheximide treated hippocampal lysate during PND14-16 in HET (top). Representative immunoblots for RPLP0 distribution in Cycloheximide and Puromycin treated polysome during PND14-16 (below). (C) Bar graph shows RPLP0 distribution in Translating/Non-translating fractions during PND14-16 (WT: N = 5; HET: N = 3; p = 0.22) and PND21-23 (WT: N = 4; HET: N = 4; p = 0.14). Unpaired Student’s t-test was done for both age groups. NS, not significant. (D) Syngap1 mRNA distribution in polysome in HET normalized to WT during PND14-16 (WT: N = 4; HET: N = 6; p = 0.0018) and PND21-23 (WT: N = 3; HET: N = 3; p = 0.3033); ∗∗p < 0.01; Unpaired Student’s t-test.

