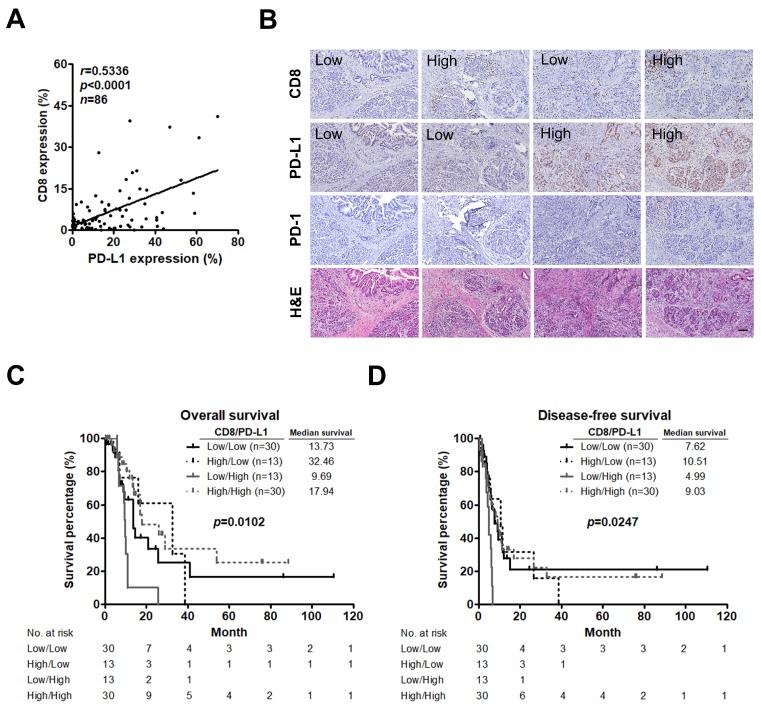
Figure 3.
Low CD8+ T cell infiltration and high PD-L1 expression significantly stratifies patient survival. (A) Correlation analysis between percent CD8+ T cells and PD-L1 expression per patient. Pearson correlation coefficient (r) and significance level (p value) is shown for correlation. (B) IHC staining of CD8+ T cells infiltration (upper panel), PD-L1 expression (second panel), PD-1 expression (third panel), and H&E staining (lower panel) in the same tumor tissues. Original magnification, 20×; scale bars, 100 μm. (C,D) Kaplan-Meier curves for OS (C) and DFS (D) of patients stratified based on CD8+ T cells infiltration and PD-L1 expression. P values determined using the log-rank test. OS, overall survival; DFS, disease-free survival.

