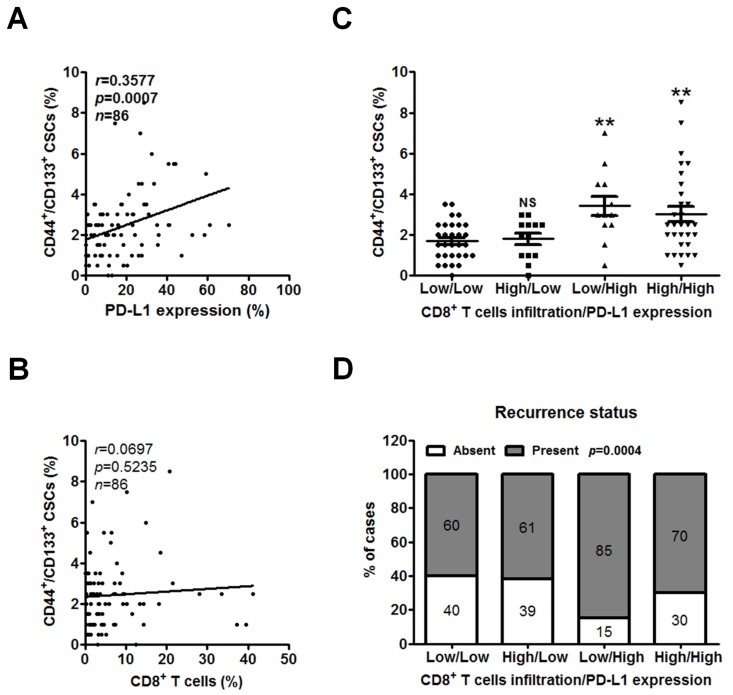
Figure 4.
Low CD8+ T cell infiltration and high PD-L1 expression are associated with CSCs and related to the recurrence of PC. (A,B) The PC TMAs were double IF stained for CSC markers CD44 and CD133 and further assessed by quantitative analysis. Correlation of percent CD44+/CD133+ CSCs with PD-L1 expression (A) or percent CD8+ T cells (B) per patient was analyzed by Pearson’s correlation. (C,D) Classification of tumors based on CD8+ T cells infiltration and PD-L1 expression into 4 groups including low CD8+ T cells infiltration/low PD-L1 expression (n = 30), high CD8+ T cells infiltration/low PD-L1 expression (n = 13), low CD8+ T cells infiltration/high PD-L1 expression (n = 13), and high CD8+ T cells infiltration/high PD-L1 expression (n = 30). (C) Dot plots showing the percentage of CD44+/CD133+ CSCs in each group. All values are the mean ± s.e.m. NS, not significant; **, p < 0.01 compared with low CD8+ T cells infiltration/low PD-L1 expression group, as determined using one-way ANOVA. (D) Relative distribution analysis of PC patients’ recurrence status within each group. Absent, patients without recurrent PC; present, patients with recurrent PC. p values calculated using Chi-square test. CSCs, cancer stem cells.

