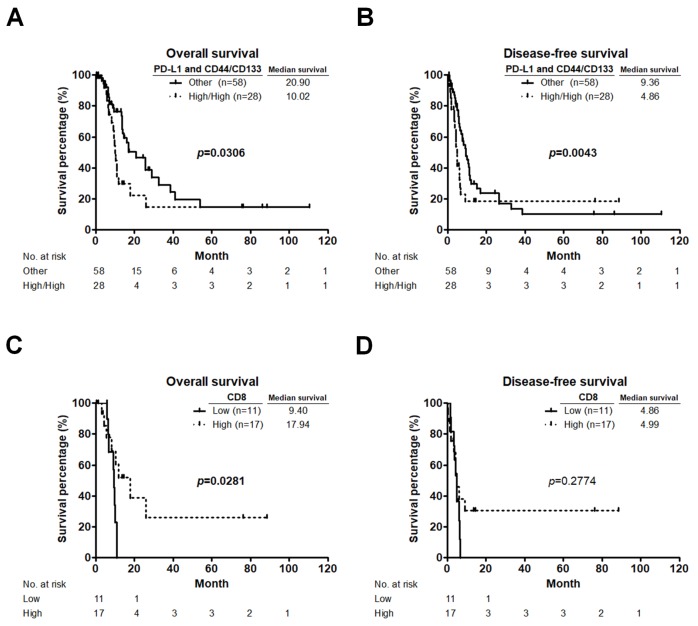
Figure 5.
CD8+ T cells infiltration affects the prognostic value of co-expression of PD-L1 and CD44/CD133 in PC patients. (A,B) OS (A) and DFS (B) curves for patients with high co-expression of PD-L1 and CD44/CD133 compared to those with either low co-expression of PD-L1 and CD44/CD133, low PD-L1 expression and high CD44/CD133 expression, or high PD-L1 expression and low CD44/CD133 expression (other group). p values determined using the Gehan-Breslow-Wilcoxon test. (C,D) OS (C) and DFS (D) curves for patients with low and high CD8+ T cells infiltration based on high co-expression of PD-L1 and CD44/CD133. p values determined using the log-rank test. OS, overall survival; DFS, disease-free survival.

