Figure 3.
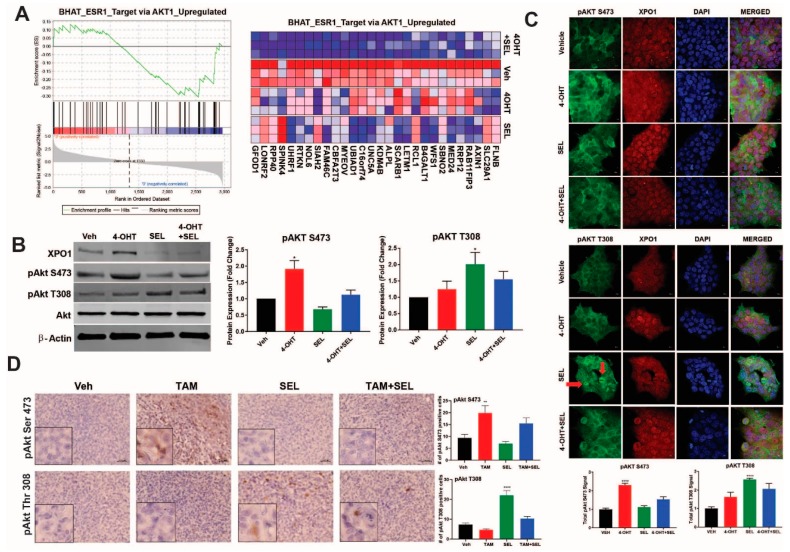
XPO1 inhibition modulates differential Akt phosphorylation in TAM-resistant cells and tumor xenografts. (A) GSEA analysis of RNA-Seq data depicting regulation of Akt signaling by the 4-OHT+SEL combination. ERα-XPO1 targeting changed XPO1 and pAkt protein expressions in both TAM-sensitive and TAM-resistant breast cancer cell lines. Western blot analysis (B) and immunofluorescence analysis (* p < 0.05) (C) of BT474 cells treated with 4-OHT (10−6 M) and SEL (10−7 M) for 24 h alone and in combination. Protein expression was quantified and is shown in bar graphs. A one-way analysis of variance (ANOVA) model was used for statistical significance of treatment effect and values were presented as mean ± SEM from three independent experiments (* p < 0.05, ** p < 0.01). scale bar = 200 pixels. (D) IHC staining of pAkt T308 and pAkt S473 in tumor samples obtained from BT474 xenografts received individual and combined TAM and SEL treatments (from Figure 1C). In the figure, red-brownish staining represents pAkt T308 and pAkt S473 proteins. This figure showed that individual 4-OHT and SEL treatments activated two different phosphorylation sites of Akt protein. The top panel indicated that SEL treatment activated pAkt T308 phosphorylation in BT474 tumor xenografts. The bottom panel showed that TAM treatment activated pAkt S473 phosphorylation in BT474 tumor xenografts. Quantification of positive staining was performed digitally by selecting four independent regions on the sample slides and the results were given in the corresponding graphs. Statistical significance was presented as mean ± SEM by using one-way analysis of variance (ANOVA) model (** p < 0.01, **** p < 0.0001). scale bar = 20 µm.

