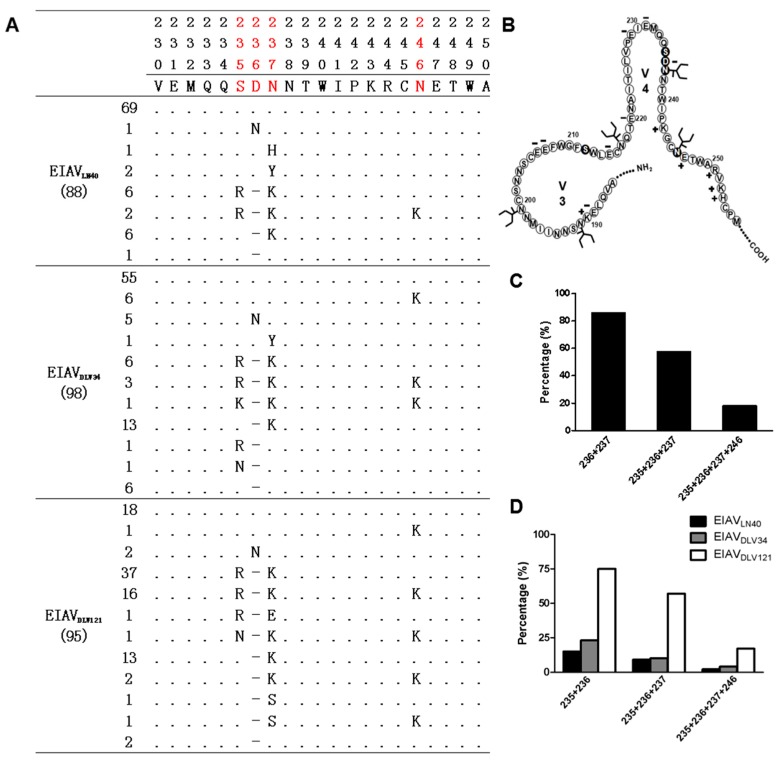
Figure 2.
Distribution of the consensus mutations located in the V3 and V4 regions and schematic structural representations. (A) Red letters are defined as critical consensus mutation sites displayed within the Env region during the EIAV attenuation process. (B) Schematic figure of the EIAVDLV121 V3 and V4 regions. N-Glycosylation sites are shown as branched lines. (C) Comparison of the proportions of several combined mutations at 235, 236, 237, and 246 for the whole mutants. (D) The percentages of these combined mutations at the key stages of vaccine development (EIAVLN40, EIAVDLV34, and EIAVDLV121).

