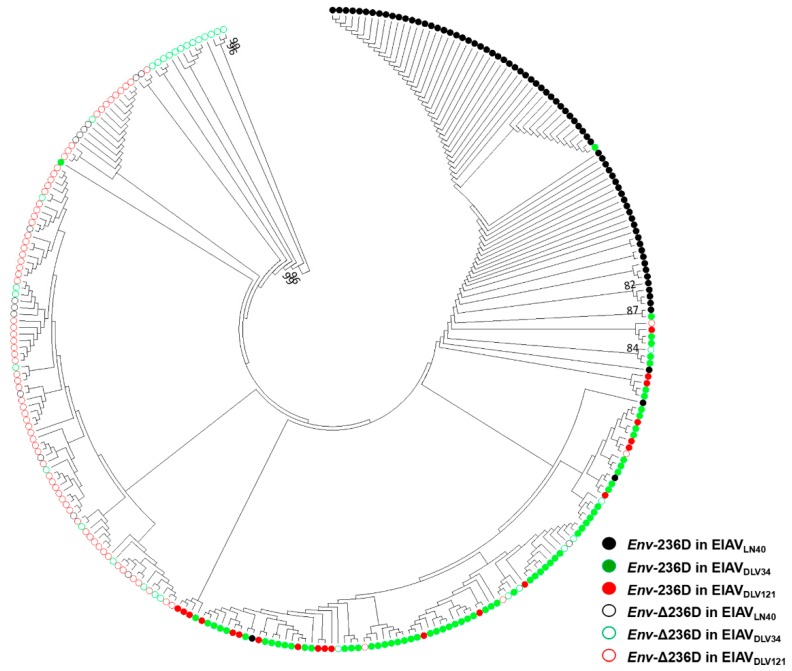
Figure 3.
Construction of a maximum likelihood tree using the MEGA 7.0 program based on the Tamura-Nei model. Bootstrap values above 80% are indicated. EIAVLN40, EIAVDLV34, and EIAVDLV121 are shown in black, green and red, respectively. Solid and hollow circles represent the env-236D-phenotype and env-Δ236D-phenotype sequences, respectively. All samples were collected from three virus strains (EIAVLN40, EIAVDLV34, and EIAVDLV121). A total of 381 sequences were analyzed.

