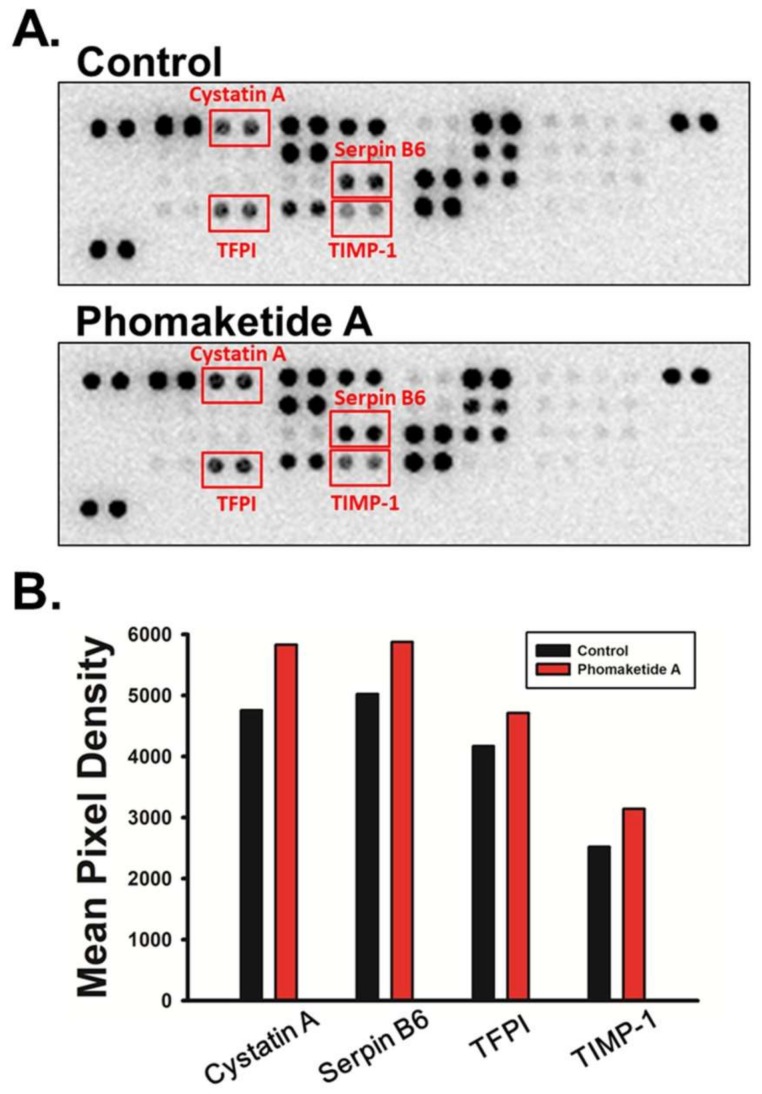
Figure 5.
Effects of phomaketide A on protease inhibitor expression profiles in human LECs. (A) LECs were treated with phomaketide A (20 μM) for 8 h, then total cell lysates were collected. Significant changes in protein spots detected by human protease inhibitor array are indicated. (B) Profiles of mean spot pixel densities for upregulated protease inhibitors were analyzed using ImageJ software.

