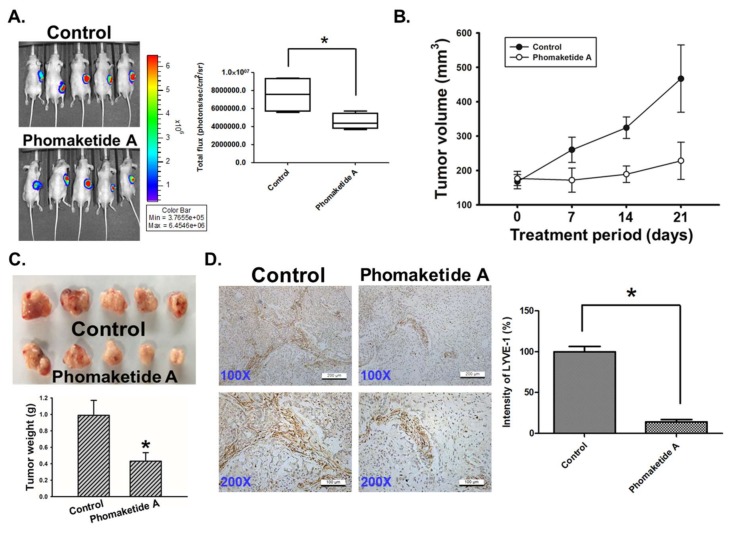
Figure 6.
Effects of phomaketide A on tumor-associated lymphangiogenesis. (A) A549-Leu cells were injected into flank sites of nude mice for 4 weeks. Then, animals (five mice/group) were given vehicle (control) and phomaketide A (20 mg/kg) by i.p. injection for 3 consecutive weeks. The tumor size was monitored by bioluminescence imaging. Representative IVIS images of tumor growth and quantitative analysis of imaging signal intensity was seen on day 21. (B) Treatment period was indicated (days 0–21), and tumor volume was measured manually every week. (C) A549 tumor samples from animals were obtained and weighted at the end of the treatment. (D) The xenograft tumors were excised and stained with lymphatic vessel marker LYVE-1 by IHC analysis (N = 4). Representative images of LYVE-1 expression in tumor specimens are seen. The quantification of LYVE-1 expression was analyzed using ImageJ software. Data are expressed as the mean ± SEM. *, p < 0.05 compared with the control group.

