Figure 1.
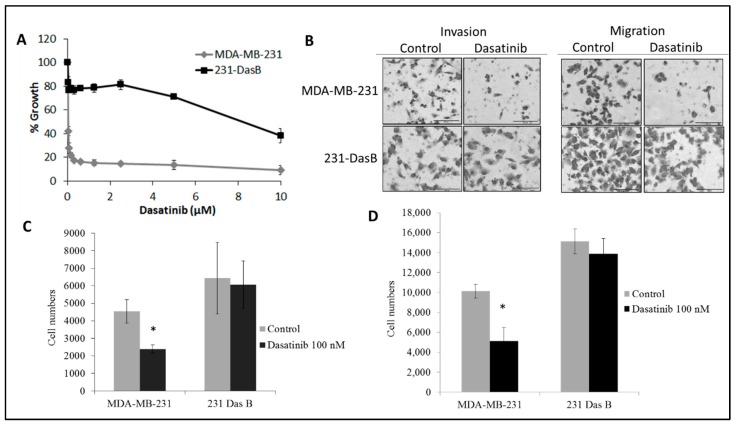
Characterisation of the 231DasB cell line: (A) Proliferation assays of MDA-MB-231 and 231-DasB with serially decreasing concentrations of dasatinib from 10 µM; (B) representative images of MDA-MB-231 and 231-DasB post-18 h 100 nM dasatinib treatment in invasion and migration assays; (C) invasion assays and (D) migration assays of MDA-MB-231 and 231-DasB post-18 h 100 nM dasatinib treatment. Error bars represent the standard deviation of triplicate experiments. * p ≤ 0.05. p values were calculated using the Student’s t-test.

