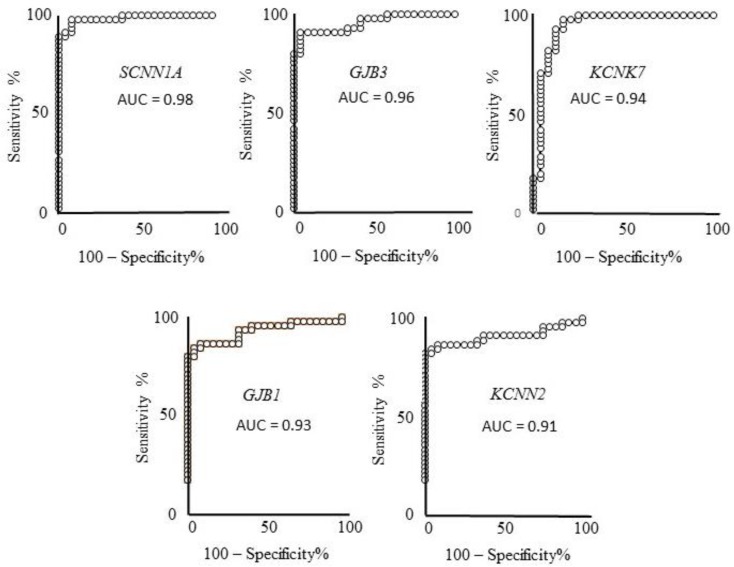
Figure 2.
ROC analysis of the five genes expression showing a very high ability to discriminate controls from melanoma samples, validated in two samples datasets. These genes also show a strong expression ratio in the third dataset and are not reported to be related to melanoma according to PubMed searches. ROC analysis evaluates how the given measure (gene-expression level in this case) relates to sensitivity (ability to detect melanoma presence) and specificity (ability to detect melanoma absence). AUC (area under curve) of SCNN1A, GJB3, KCNK7, GJB1, and KCNN2 indicate very high ability of their expression levels to discriminate melanoma from controls, namely 98%, 96%, 94%, 93%, and 91%, respectively.

