Figure 1.
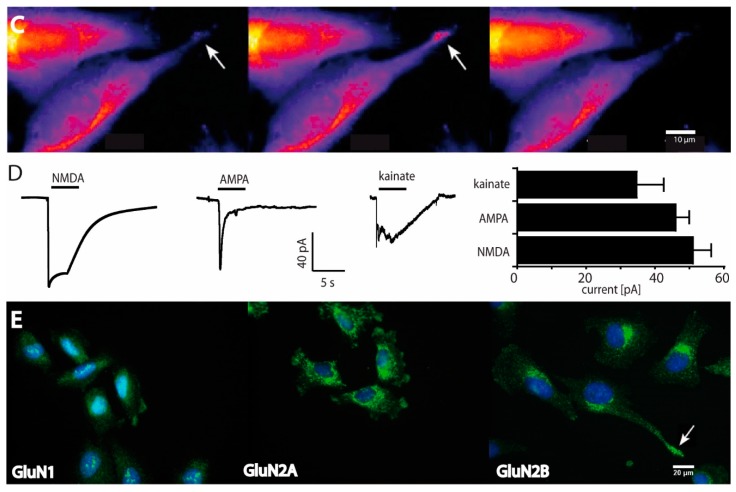
LN229 glioblastoma cells express functional NMDARs. (A) Ca2+-imaging of LN229 cells labeled with Fluo-4 AM displayed in ~50% of the cells a significant increase in relative fluorescence after glutamate/glycine (100 µM Glu/10 µM Gly) treatment (20 s). As an internal control, 10 µM ionomycin was given after 90 seconds. The integrated density of two non-responding (black) and two responding (red) cells are displayed. (B) Representative image of nuclear Ca2+-signals in four cells responding to Glu/Gly application (20 seconds before and after application). Scale bar 20 µm. (C) Images of Ca2+-signal oscillations in cell extensions (white arrows) 1, 4 and 10 seconds after Glu-application. Scale bar 10 µm. (D) Agonist-mediated traces and maximal inducible currents (Imax) of kainate (100 µM), AMPA (100 µM) and NMDA (100 µM) analyzed by patch-clamp measurements (n = 22). Values of the Imax represent means ± SEM. (E) Immunostaining for GluN1, GluN2A and GluN2B NMDAR subunits with anti-GluN1, anti-GluN2A and anti-GluN2B (FITC, green) merged with DAPI (blue). GluN2B subunit expression in cell lamellipodia is indicated by white arrow. Scale bar 20 µm.


