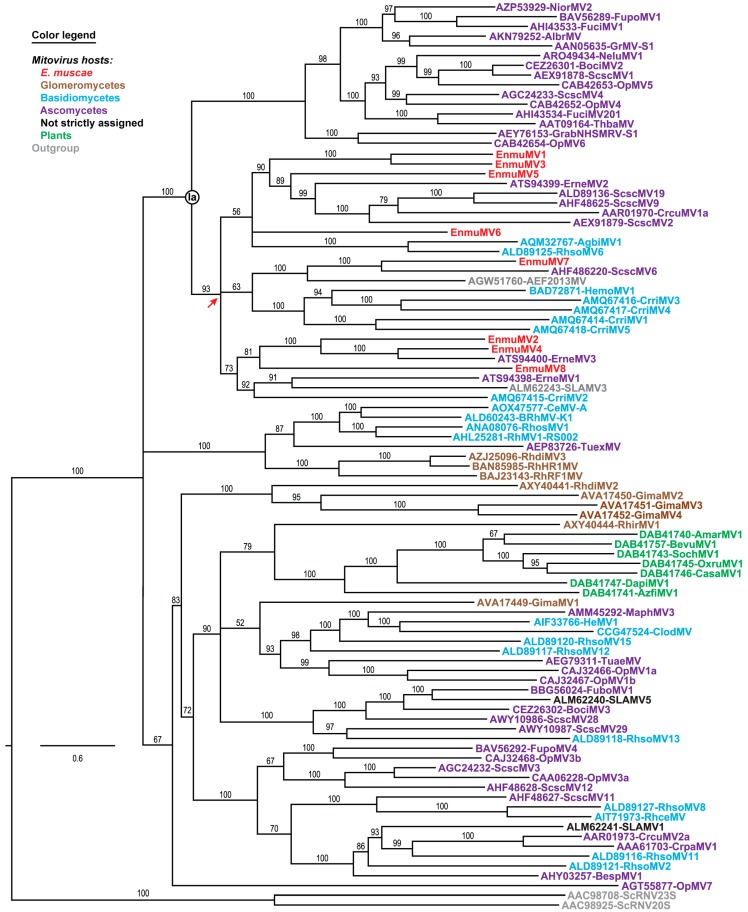
Figure 3.
Maximum-likelihood phylogenetic analysis of E. muscae mitoviruses and representative other mitoviruses. Deduced RdRp sequences were aligned using MAFFT-L-INS-i. The best-fit substitution model (per BIC score) used for the phylogenetic analysis shown here was LG + F + R8. The site proportions and rates for the FreeRate model were (0.0224, 0.0123) (0.0271, 0.0755), (0.0627, 0.2087), (0.1161, 0.4202), (0.1784, 0.6877), (0.2655, 1.0570), (0.2163, 1.4069), and (0.1115, 2.0462). The tree is displayed as a rectangular phylogram rooted on a set of two members of current genus Narnavirus included as outgroup. Branch support values from UFboot (1000 replicates) are shown in %; branches with <50% support have been collapsed to the preceding node. Scale bar indicates average number of substitutions per alignment position. Previously identified clade Ia of current genus Mitovirus is labeled. Red arrow, most recent common ancestor shared by all eight E. muscae mitoviruses. Virus names matching the sequence accession numbers and abbreviations are provided in Table S6. Color-coding: mitoviruses from E. muscae (subphylum Entomophthoromycotina, phylum Zoopagomycota), red; members of subphylum Glomeromycotina, phylum Mucoromycota, brown; members of phylum Basidiomycota, cyan; members of phylum Ascomycota, purple; not assigned to a specific fungal host, black; plants, green; and outgroup, gray.

