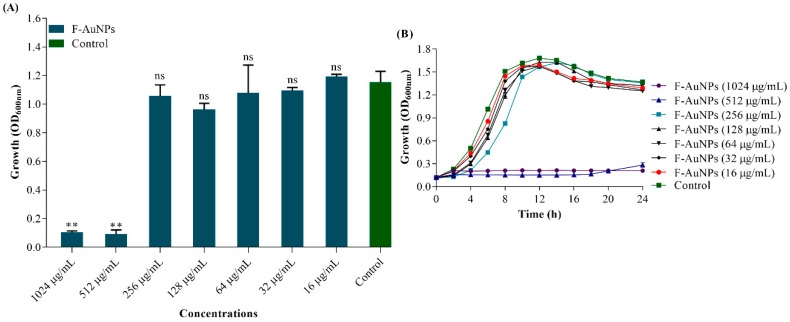
Figure 3.
(A) Determination of minimum inhibitory concentration of F-AuNPs at 600 nm wavelength and (B) growth curve analysis of P. aeruginosa in the presence of different concentrations of F-AuNPs at every 2 h time interval the OD at 600 nm wavelength. The experiments were performed in triplicate with two independent cultures. ** p < 0.01 considered as significant and ns indicates non-significant as compared to the control (not treated by F-AuNPs).

