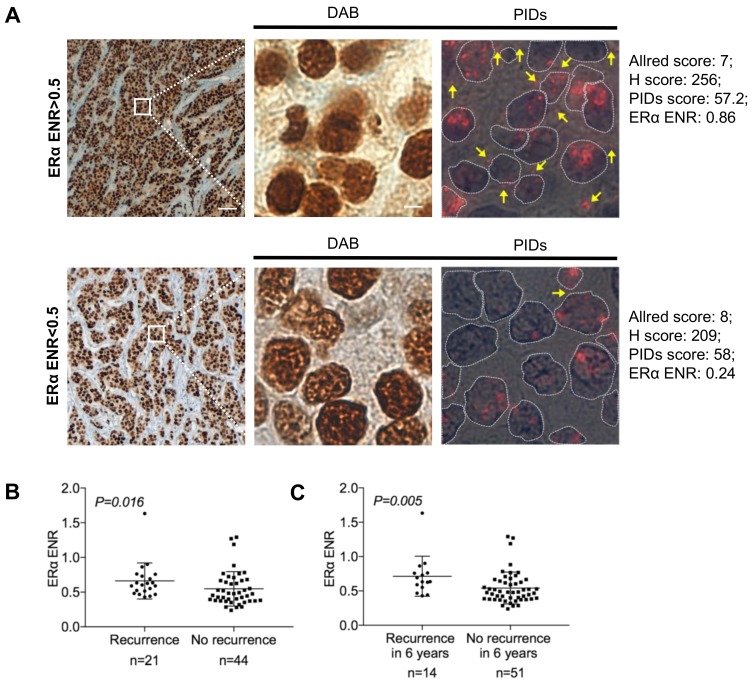
Figure 5.
The correlation of the ERα ENR with recurrence and 6-DFS. (A) Conventional IHC-DAB (diaminobenzidine) and IHC-PIDs of two typical samples (top: recurrence; bottom: no recurrence). Two samples have similar Allred score, H score, and PIDs score of ERα expression, but they have opposite outcome. (B) Box plots with the continuous ERα ENR on the y-axis and recurrence or no recurrence on the x-axis. (C) Box plots with the continuous ERα ENR on the y-axis and 6-DFS on the x-axis.

