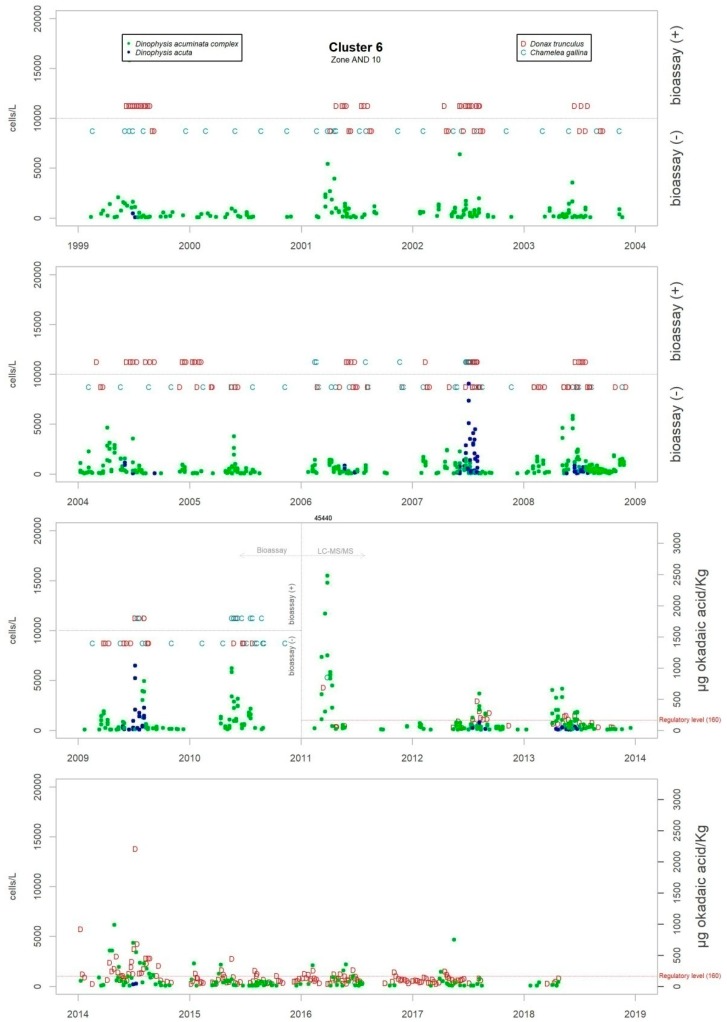
Figure A2.
Temporal series of the abundance of D. acuminata and D. acuta and the concentration of okadaic acid in the species of mollusc monitored in each harvest area, in cluster 6. The order of the sequence of figures from Figure A1 to Figure A7 follows the geographic order of the clusters from west to east.

