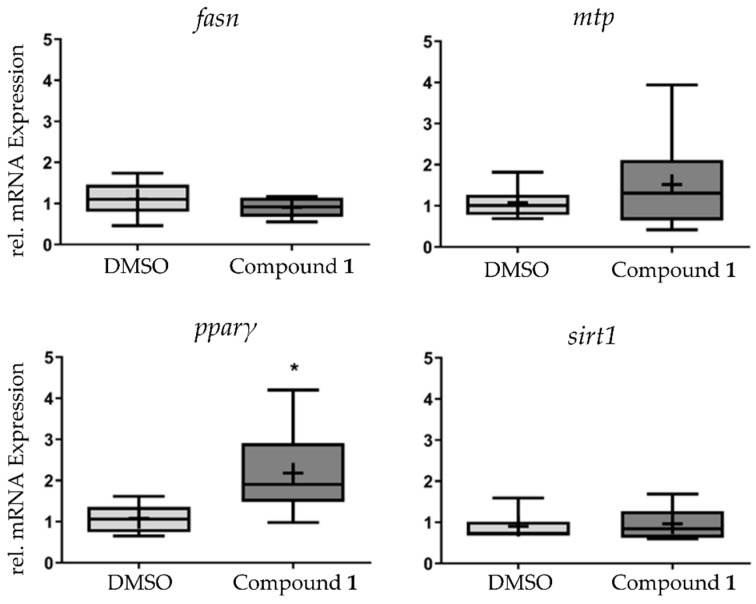
Figure 5.
Analysis of messenger RNA (mRNA) expression of fasn, mtp, pparγ, and sirt1 after exposure to 1 at the half maximal effective concentration (EC50) for 48 h. Data are presented as box-whisker plots (5–95%) from n = 8 replicates, consisting of each replicate from a pool of 10 zebrafish larvae. Significant differences are presented as asterisks, * p < 0.05.

