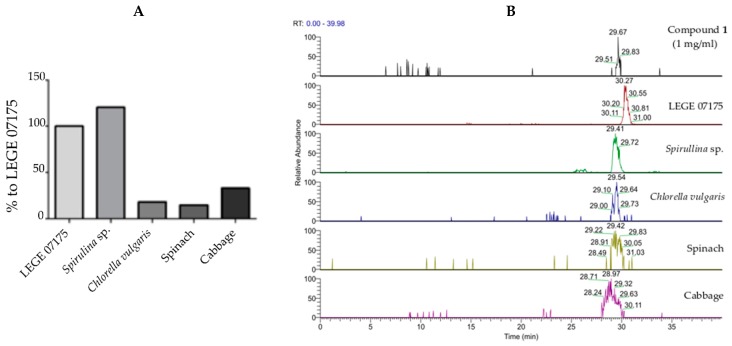
Figure 6.
Comparative quantification of 1 in different materials. (A) Quantification data are shown as percentage relative to the producing strain of 1. Samples were prepared at 1 mg/mL in MeOH (100%). (B) LC-ESI-MS analysis of the selected samples showing the presence of 1 in all selected materials, compared to the standard (compound 1) retention time. The peaks selected for analysis had a mass range of m/z 887.5593–887.5793 and the following retention times: Compound 1, 29.67 min; LEGE 07175, 30.27 min; Spirulina sp., 29.41 min; Chlorella vulgaris, 29.54 min; spinach, 29.42 min; and cabbage, 28.97 min.

