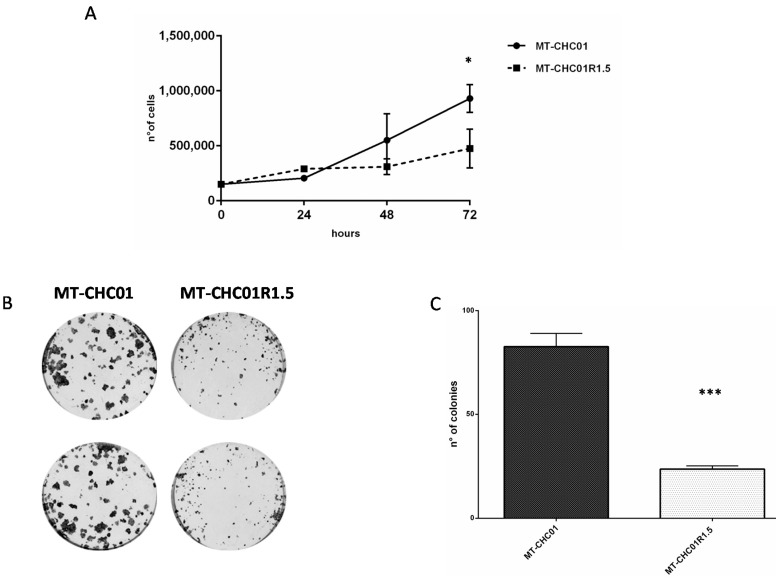
Figure 2.
Differences in cell growth and colony formation. (A) Growth curves of MT-CHC01 and MT-CHC01R1.5 cells: 1.5 × 10⁵ cells were plated in 6-well plates in triplicate in three different experiments in optimal medium. Viable cells were counted at 24, 48, and 72 h after seeding. (B) Colony formation assay on MT-CHC01 and MT-CHC01R1.5 cells: Representative images of colony formation after 10 days of seeding. (C) Quantification of colony formation. Colonies formed by more than 10 cells were counted in triplicate in three different experiments. There is a statistically significant difference in terms of the number of colonies between MT-CHC01 and MT-CHC01R1.5 (p = 0.0001). Error bars represent the mean and SD. * p = 0.01, *** p = 0.0001.

