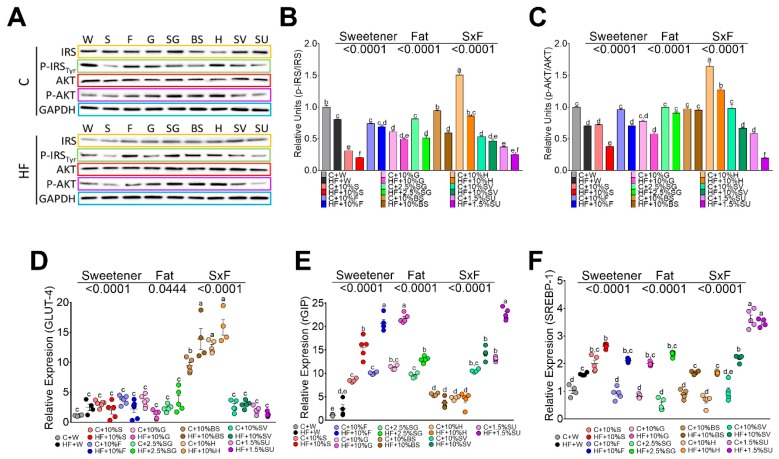
Figure 3.
Relative protein abundance of insulin signaling pathway in white adipose tissue. IRS, pT263 IRS1, AKT, and pS473AKT in rats fed different sweeteners with or without high fat diet (A); phosphorylated IRS/total IRS ratio (B); phosphorylated AKT/total AKT ratio (C); relative expression of glucose transporter type 4 (GLUT 4) (D), GIP receptor (E) and sterol regulatory element-binding protein 1 (F). The data are expressed as the mean ± SEM (n = 6). Results were considered statistically significant at p < 0.05. Significant differences among groups are indicated by letters, where a > b > c > d > e.

