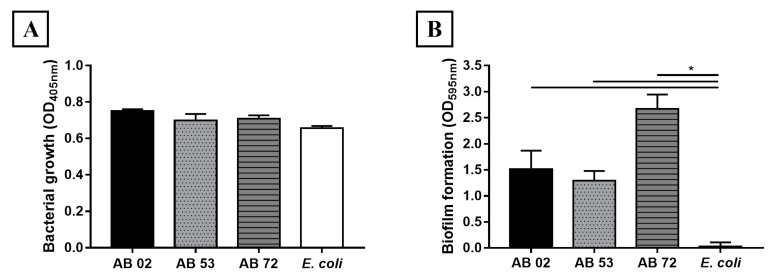
Figure 1.
Acinetobacter baumannii biofilm formation. (A) The bacterial growth of Acinetobacter baumannii AB 02, AB 53, AB 72, and Escherichia coli (control) were incubated with LB + Glu for 24 h at 29 °C and the growth was determined by OD readings at 405 nm. (B) After this period, the presence of biofilms was evaluated using crystal violet dye staining. The bars represent the mean and standard deviations of triplicates. * Significant difference between biofilm formations by A. baumannii clinical isolates compared to E. coli (p < 0.05).

