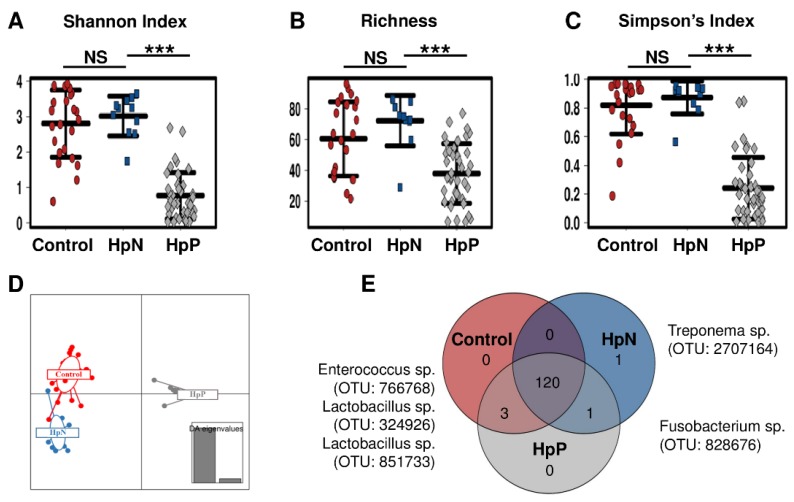
Figure 1.
Alpha diversity and unique taxonomy by comparison groups. Shannon index (A); bacterial richness (B); Simpson’s index (C); (D) discriminant analysis of principal components (DAPC); (E) Venn diagram for overall operational taxonomic units (OTU) taxonomy are shown according to HpN, HpP and control groups. Venn diagram based on the absence or presence of taxonomies showed 120 species were core, four species were pan and one species were determined as unique taxonomy among comparison groups. NS: not significant, *** p < 0.001.

