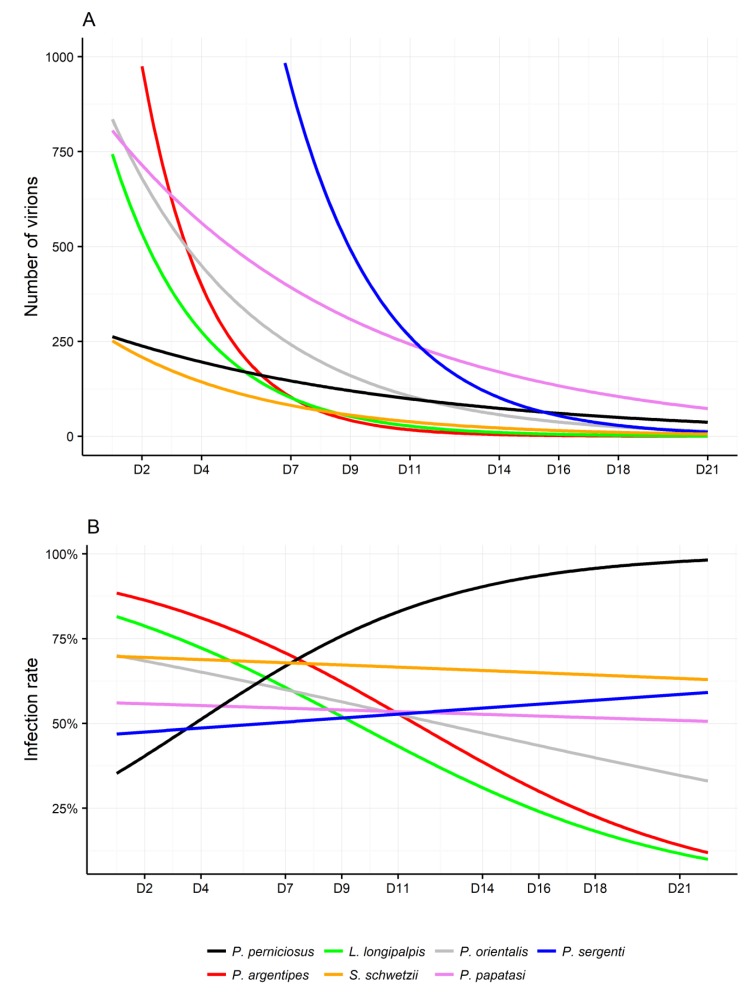
Figure 3.
Fitted lines for (A) infection rate and (B) viral loads in phlebotomine females from different colonies. Fitted lines are calculated from the original data (Table S4) according to models with (A) quasi-poisson and (B) quasi-binomial distribution. P., Phlebotomus; L., Lutzomyia; S., Sergentomyia.

