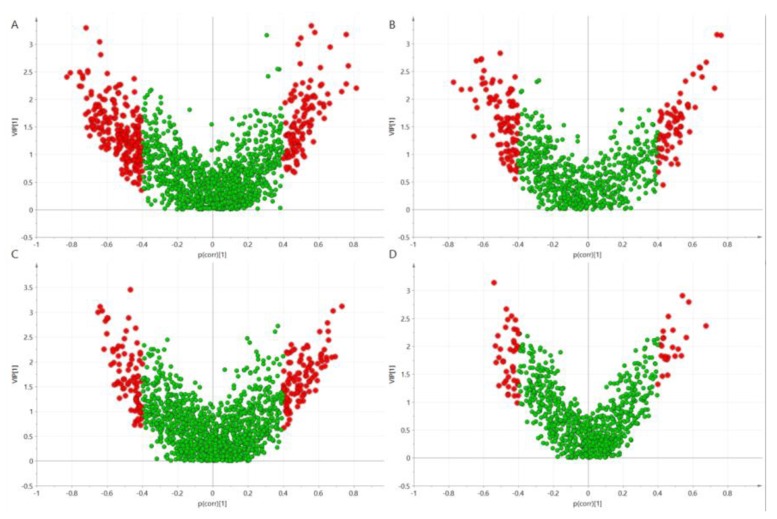
Figure 1.
Volcano plots build on the Partial least square discriminant analysis (PLS-DA) models computed based on the area under the curves (AUCs) of plasma metabolites after norma-carbohydrate (NC)-meal for ESI+ (A) and ESI- (B) and high carbohydrate (HC)-meal for ESI+ (C) and ESI- (D). Red color marks metabolic features significantly differenting HR-genotype (CC) and LR-genotype (CT/TT) carriers.

