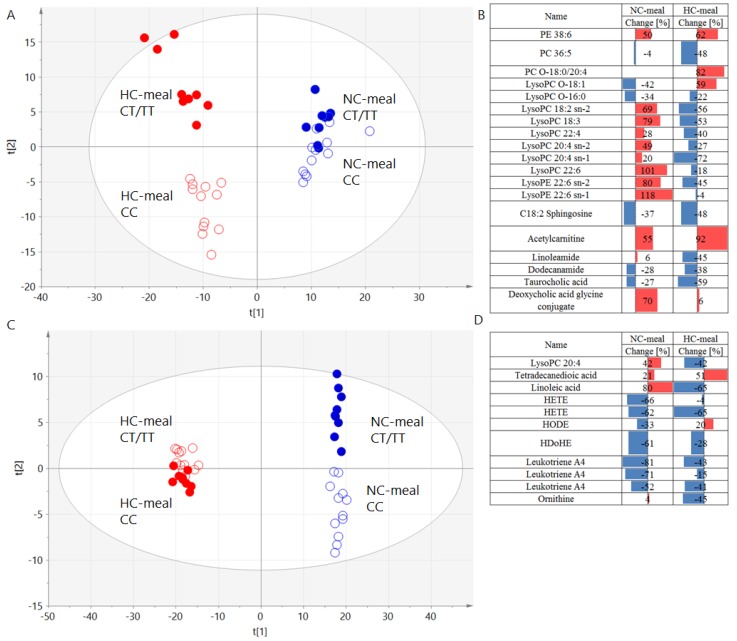
Figure 3.
PLS-DA models computed based on AUCs of plasma metabolites illustrating clear separation between men carrying CC (empty dots) and CT/TT (full dots) genotypes after NC- (blue color) and HC-meal (red color) for ESI+ (panel A) and ESI- (panel C) with the summary of the differentiating signals and their change in ESI+ (panel B) and ESI- (panel D). The parameters of the models: R2 = 0.581, Q2 = 0.318 for ESI+; R2 = 0.594, Q2 = 0.0.264 for ESI-. R2 = explained variance, Q = predictive capability of the model.

