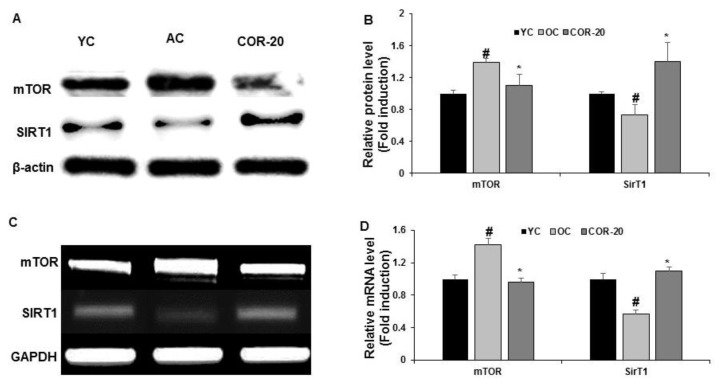
Figure 6.
Effect of COR on protein expression levels of mTOR and SIRT1in testis tissue. (A) Protein expression of mTOR and SIRT1. (B) Relative expression levels (fold) in three independent experiments normalized to β-actin. (C) The mRNA expression of mTOR and SIRT1. (D) Relative expression levels (fold) in three independent experiments normalized to GAPDH. # p < 0.05, compared with YC group and * p < 0.05 compared with the AC group. YC, young rat group; AC, aged rat group; COR-20, cordycepin (20 mg/kg) treated AC group; mTOR, growth-related mammalian target of rapamycin; SIRT1, silent mating type information regulation 2 homolog; GAPDH, glyceraldehyde 3-phosphate dehydrogenase.

