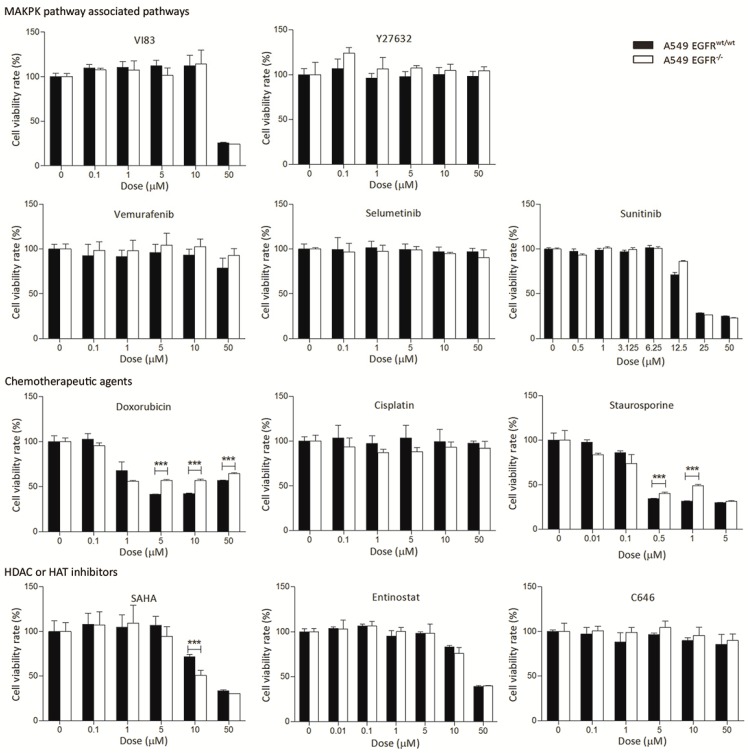
Figure 2.
Treatment of the A549 EGFRwt/wt and EGFR−/− cells with different drugs. Cells were treated with drugs at indicated concentrations for 72 h and cell viability was determined with an MTS assay. For staurosporine, cell viability was determined after 24 h due to its toxicity. Data in bar graphs are represented as mean ± SD (n ≥ 3); two-tailed unpaired student’s t-test: * p-values < 0.05; ** p-values < 0.01; *** p-values < 0.001; ns: not significant.

