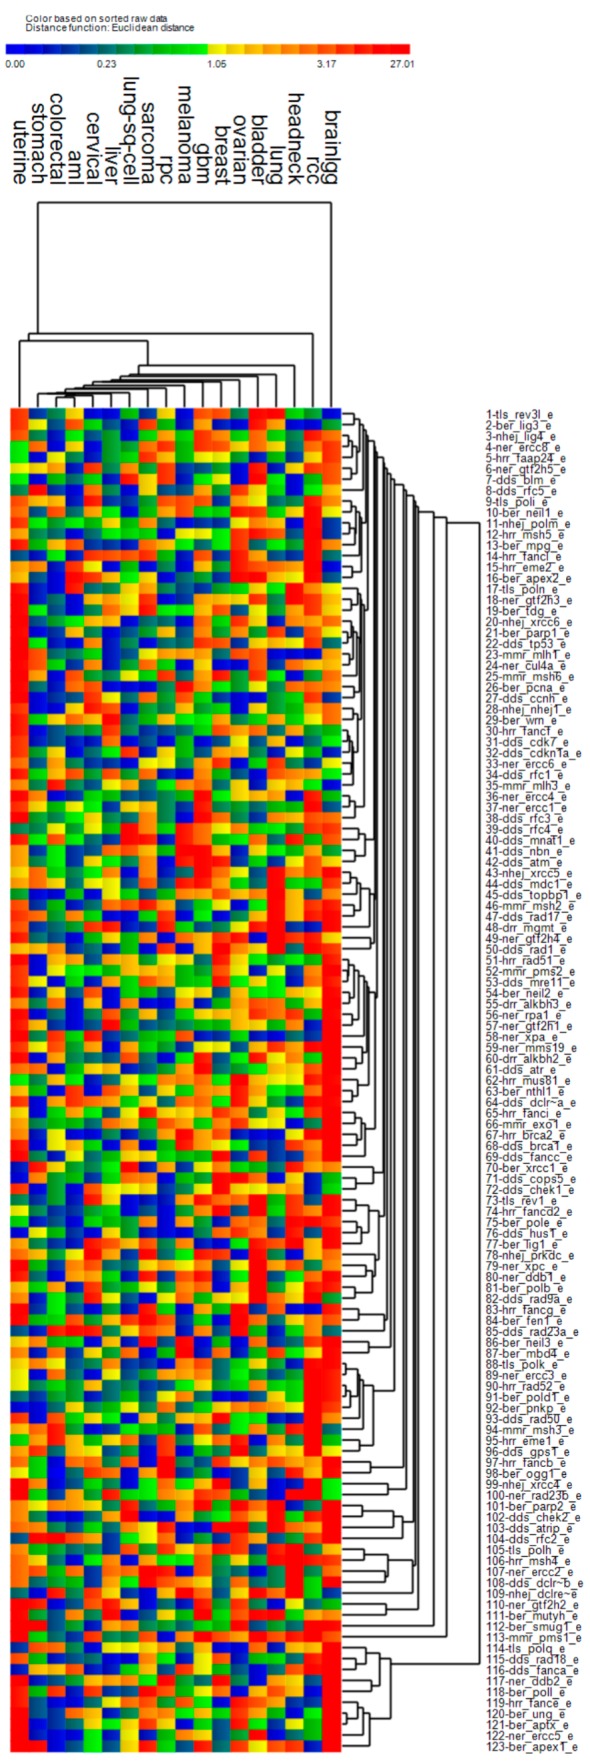
Figure 2.

Chi-squared test statistics from Kaplan-Meier (KM) tests based on DNA repair gene expression adjusted for age and stage at diagnosis, and the PCNA metagene. Gene-specific adjusted expression values were split into two groups based on a median cut-point. Heat map colors represent chi-squared values for each KM test, where blue-green-yellow-orange denotes non-significant tests and red denotes significant tests, i.e., χ2 > 3.84.
