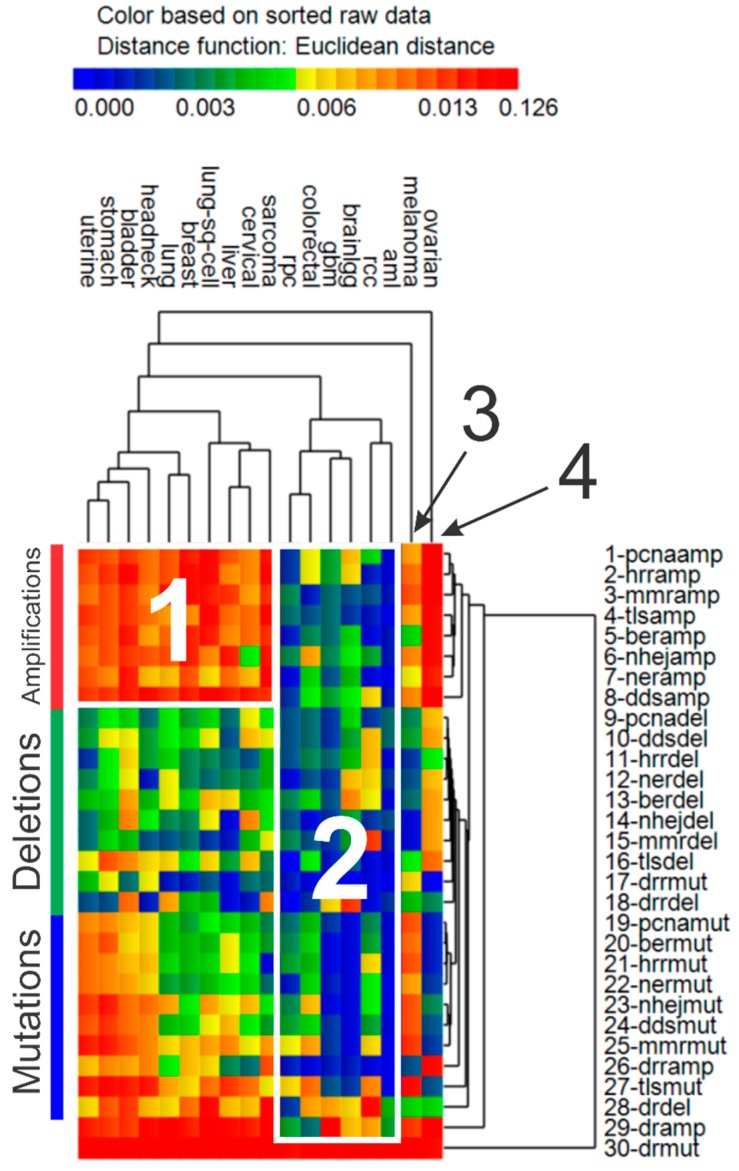
Figure 3.
Genomic event rates (GER). Hierarchical cluster analysis results of GER (per tumor-gene) for somatic mutations (“mut”), deletions (“del”), and amplifications (“amp”) in driver genes (“dr”) and the 8 groups of DNA repair genes (DRR, BER, NHEJ, MMR, TLS, DDS, HRR, NER). Euclidean distance used as the distance function, with unweighted pair group method with arithmetic mean (UPGMA) as the agglomeration method. Heat map colors represent GER.

