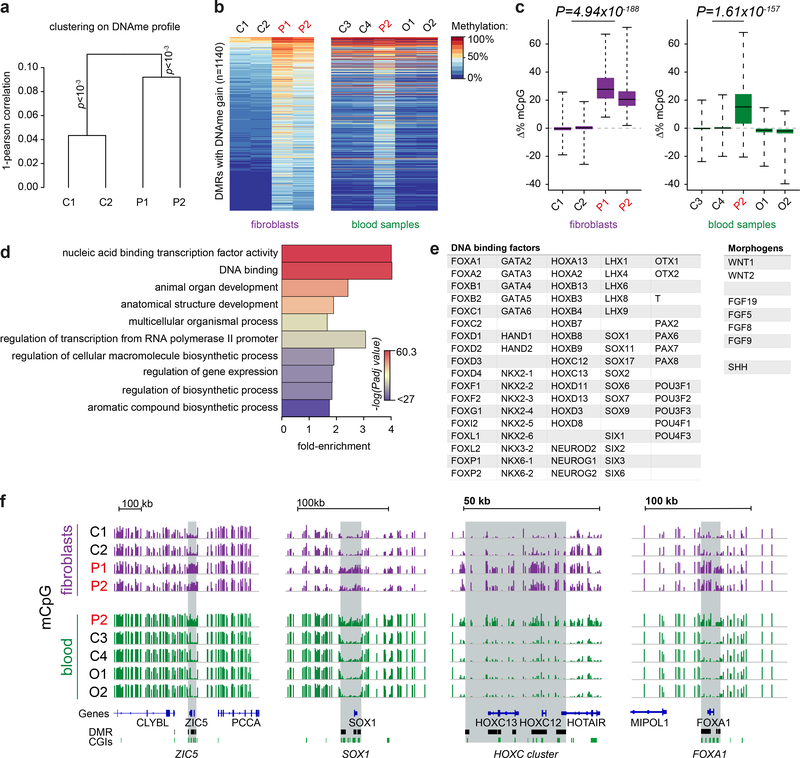
Fig. 3|. DNA methylation is increased at key developmental gene loci in patient cells.
a, DNA methylation in DNMT3AW330R/+ patient fibroblasts significantly differs from controls. Unsupervised Ward clustering based on Pearson correlations of all probes from Illumina EPIC arrays for n=2 independent patients and 2 independent controls. Pvclust, approximately-unbiased p-values using 1000 bootstraps. b,c, A methylation signature is evident in DNMT3AW330R patient cells across tissues, comprising 1140 sites of increased methylation. (b) Heat map of differentially methylated regions (DMRs) hypermethylated in patient fibroblasts and peripheral blood leukocytes (PBLs). P1, P2, patients (DNMT3AW330R/+); C1-C4 healthy controls; O1, O2, TBRS overgrowth patients. (c) Quantification of DNA methylation for DMRs (n=1140 DMRs) depicted in panel (b). Box, 25th-75th percentile; whiskers, full data range; centre line, median; Δ%mCpG, percent change of methylation relative to mean of control. p value, two-sided, paired Wilcoxon rank sum tests for mean of control probes vs mean patient probes. d, Gene ontology analysis of genes associated with hypermethylated DMRs. Top ten significant hits shown. Color indicates Benjamini-Hochberg adjusted FDR significance level, genes associated with DMR probes (n=907 genes) versus genes associated with all probes on the array (n=18159), two-sided Fisher’s exact test. e, Exemplars of DNA binding factors and morphogens associated with DMRs. f, Representative genome browser views of hypermethylated DMRs demonstrating increased DNA methylation at key developmental genes in microcephalic dwarfism patient samples. All tracks scaled 0–100% mCpG, DNA methylation. CGI, CpG islands.

