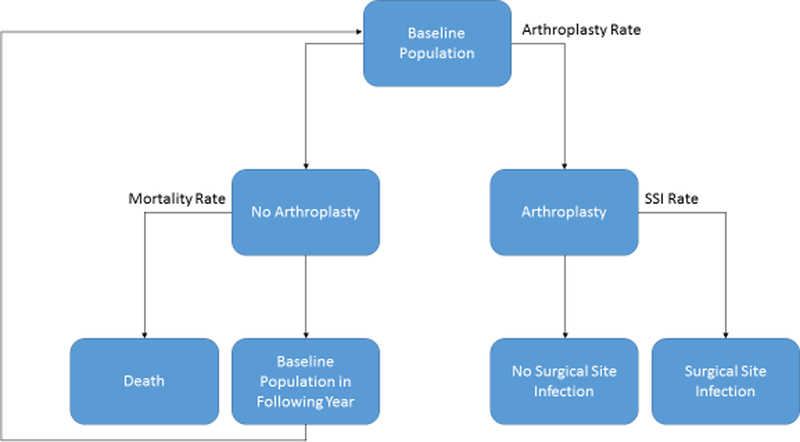
Figure 1.

Flow chart depicting general model for obtaining annual arthroplasty and surgical site infection (SSI) counts. Arthroplasty rates were applied to the baseline population, and SSI rates are applied to this resulting population receiving arthroplasties. Mortality rates were not applied to individuals between arthroplasty and SSI branches (by definition 90 days or less). The cycle was repeated annually, with the baseline population as the population aged 1 year from the previous year without an arthroplasty or death. The model was run separately for primary and revision hip and knee arthroplasty (4 separate models).
