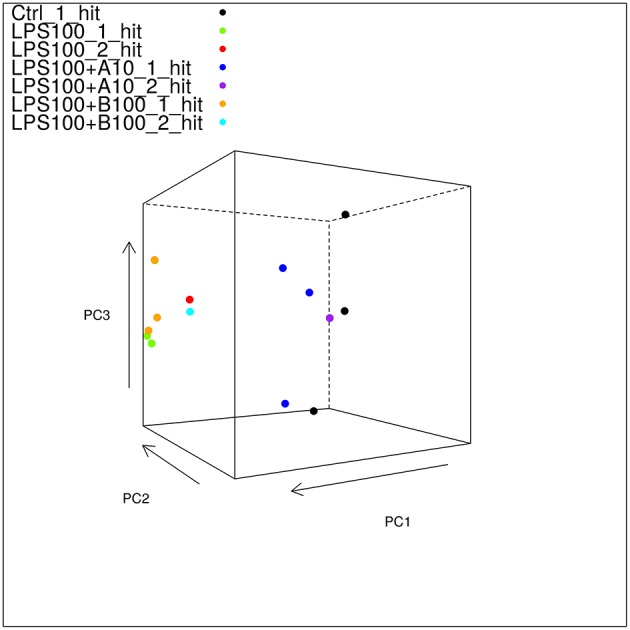
Figure 3.

Static 3D plot of the astrocyte RNAseq data with single and double-hit LPS treatment. The angle of the plot was chosen to give the best viewpoint to show differences between the sample types. Note that controls and α7nAChR agonistically pre-treated astrocytes cluster together and separately from those exposed to LPS w/o or with antagonistic α7nAChR pre-treatment. Note here that there are three of the LPS_100_1_hit samples in the plot shown in this figure; it just so happens that the third sample is obscured by the uppermost LPS+B100_1_hit sample.
