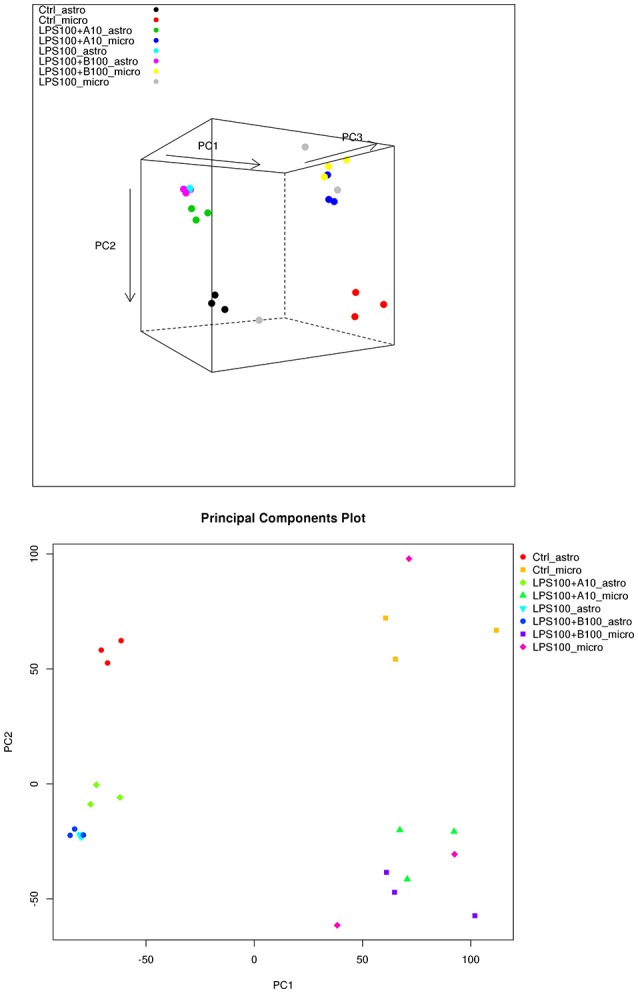
Figure 4.

(Top) PCA plot of microglia and astrocyte samples. Here we can see that astrocytes and microglia separate on the first principal component, and the second principal component captures the LPS treatment differences. The third principal component captures some intra-treatment variability for the microglia samples, particularly for one of the LPS treated microglia samples. (Bottom) PCA plot of microglia and astrocyte samples, showing just the first two principal components. The largest differences appear to be between the cell types.
