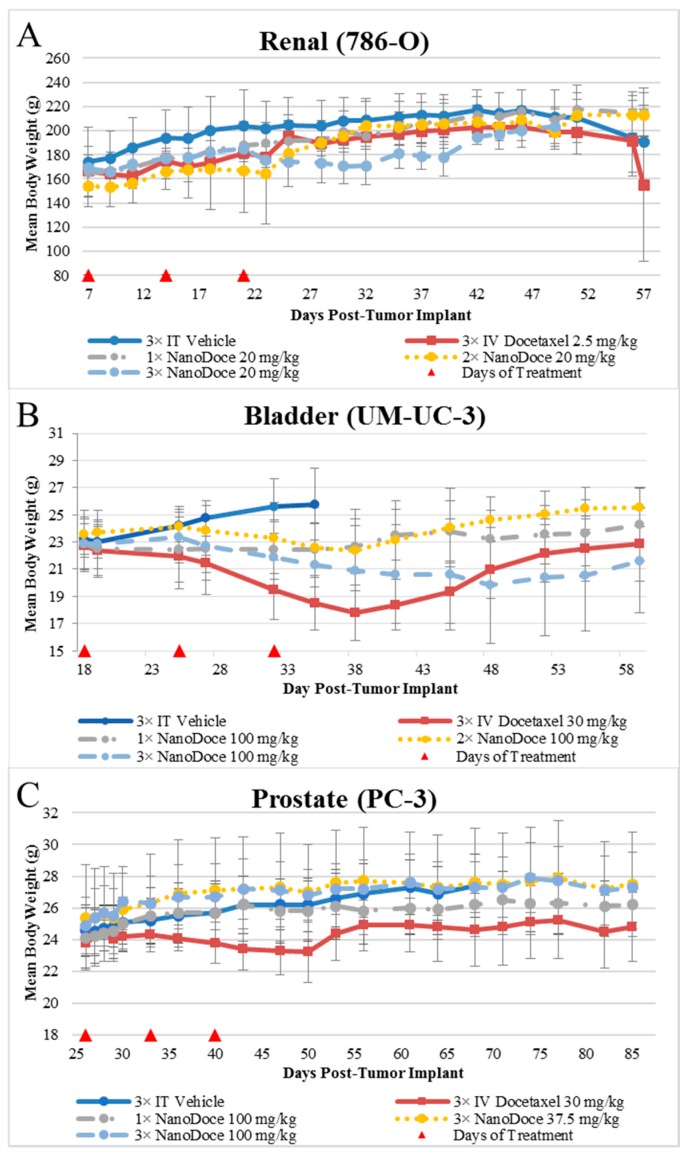
Figure 2.
Mean body weights from treatment initiation through study end. Data plotted through point when ≥50% of animals in group survived. Error bars = ±1 Std. Dev. (A) Female rats implanted with 786-O tumors; n = 3/group. (B) Female mice implanted with UM-UC-3 tumors; n = 9 or 10/group. (C) Female mice implanted with PC-3 tumors; n = 10/group.

