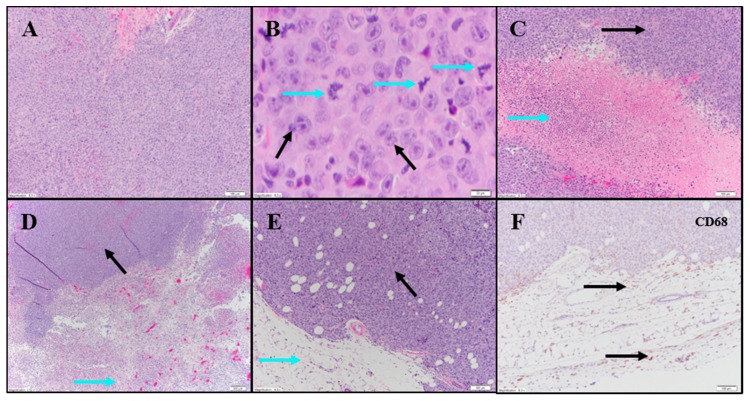
Figure 7.
Representative photomicrographs of bladder tumors. Row 1: Untreated carcinoma. (A) Sheets of TCs 10×. (B) Same animal as in (A): Large TCs with prominent nucleoli (black arrows) and a marked increase in mitotic figures (blue arrows) 40×. (C) Same animal as in (A): Area of TCN (blue arrow) flanked by viable carcinoma (black arrow) 10×. Row 2: (D) IT vehicle: extensive necrosis in bottom half of image (blue arrow) and viable carcinoma in top left (black arrow) 4×. (E) IV Docetaxel: Viable carcinoma (black arrow). Surrounding fatty tissue with a sparse immune cell infiltrate (blue arrow) 10×. (F) Anti-CD68 shows mild macrophage infiltrate in surrounding stroma (black arrows) 10×.

