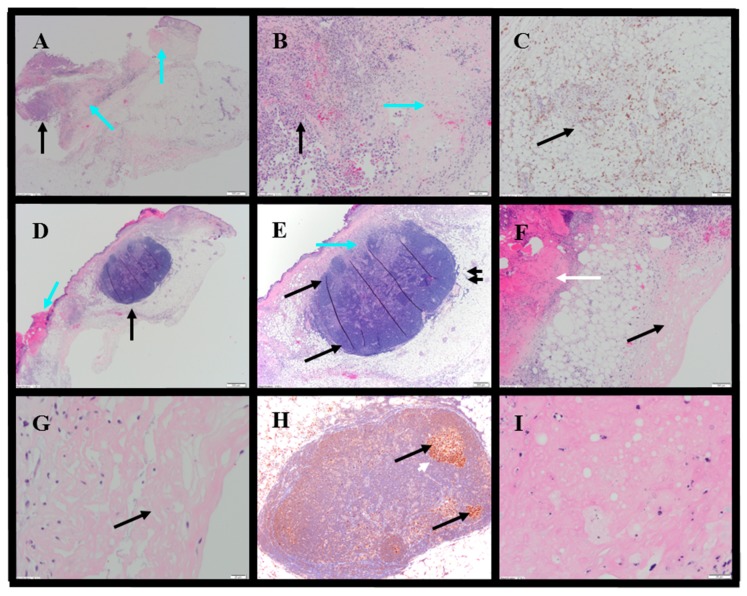
Figure 8.
Representative photomicrographs of bladder tumors. Row 1: 1× IT NanoDoce®. (A) H&E: extensive TCN (blue arrows). Focal viable carcinoma measuring 2.5 mm (black arrow) 2×. (B) Extensive TCN in panel (A)—viable TCs (black arrow) and necrosis (blue arrow) 10×. (C) Anti-CD68 shows mild macrophage infiltrate (black arrow) in the surrounding fatty tissue 10×. Row 2: 2× IT NanoDoce®. (D) Skin ulceration (blue arrow) with underlying necrosis. A lymphoid structure (LS (black arrow)) 2×. (E) LS: discrete demarcation from the surrounding fat (double black arrows). LS organization includes a hilar region that contains sinuses (blue arrow) and lymphoid follicles (black arrows) 4×. (F) Same as in (D)—ulcerated skin at left (white arrow), necrotic tissue at right (black arrow) 10×. Row 3: (G) Necrotic area in panel F shows homogenous amorphous necrotic material with no viable TCs 40×. (H) 3× IT NanoDoce®: Anti-BCL6 shows LS containing lymphoid follicles composed of BCL6+ germinal centers (black arrows) surrounded by mantle zone B-cells that do not express BCL6 (white arrow) 10×. (I) 3× IT NanoDoce®: Area of amorphous necrotic material with no viable TCs 60×.

