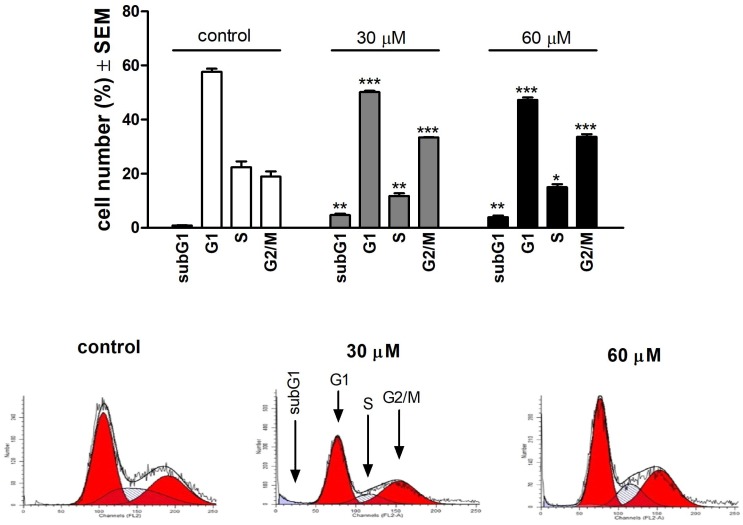
Figure 2.
Upper panel: effects of API on the A375 human melanoma cell cycle after incubation for 24 h. Results are mean values ± SEM from three measurements. *, ** and *** indicate p < 0.05, p < 0.01 and p < 0.001 as compared with the control cells, respectively. Lower panel: representative histograms.

