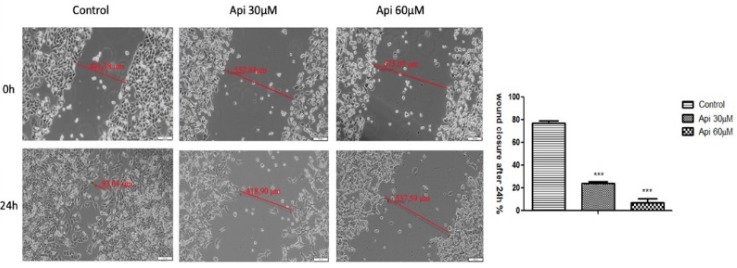
Figure 3.
Antiproliferative effect of Api on the human melanoma A375-cell line, after stimulation with Api at 30 μΜ and 60 μΜ concentrations. Images were taken by bright field microscopy at 10× magnification. Scale bars represent 100 μm. The bar graphs are expressed as percentage of wound closure after 24 h compared to the initial surface. The data represent the mean values ± SD of three independent experiments. One-way ANOVA analysis was performed to determine the statistical differences followed by Tukey post-test (*** p < 0.001 vs. control—no stimulation).

