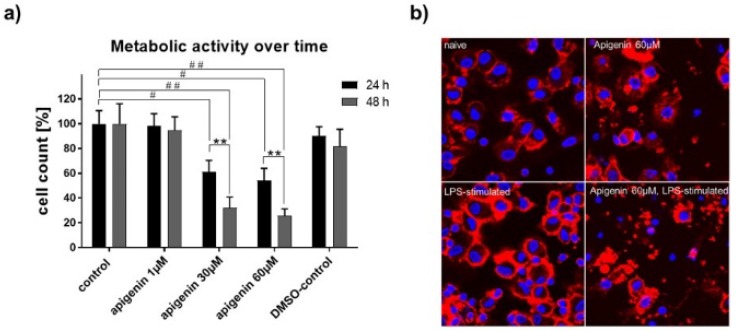
Figure 9.
(a) XTT assay for metabolic activity of human dendritic cells stimulated with vehicle, Api in different concentrations or DMSO in the presence of LPS for 24 h and 48 h. (b) Representative confocal microscopic images of human dendritic cells treated with vehicle or 60 µM Api in absence (upper panel) or presence (lower panel) of LPS for 48 h (magnification 63x). Data are expressed as mean ± standard deviation (SD); significant differences are indicated as ** p < 0.01; ## p < 0.01, # p < 0.05; n = 4.

