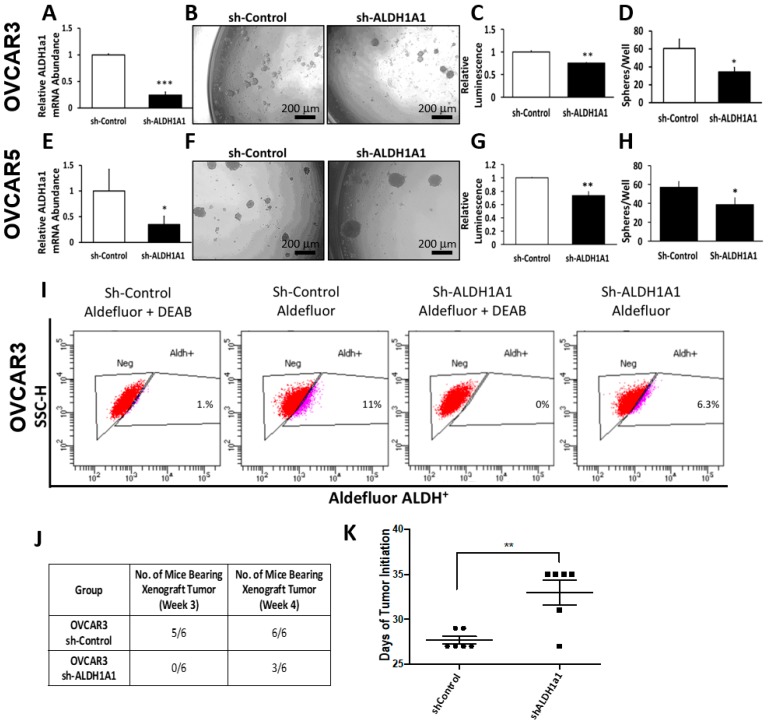
Figure 3.
Effects of ALDH1A1 knock down on stemness phenotype. (A) OVCAR3 cells were transfected with nontargeting shRNA (Sh-Control) or shRNA targeting ALDH1A1 (sh-ALDH1A1), and ALDH1A1 knockdown was verified by qRT-PCR. (B,D) Sphere formation in OVCAR3 cells stably transfected with sh-Control and sh-ALDH1A1 and plated under low attachment conditions for six days. Spheres were photographed (100× magnification, B); numbers of live cells were assessed by using the Cell-Titer Glo assay (C), and the numbers of sphere per well were counted (D). (E) OVCAR5 cells were transfected with sh-Control or sh-ALDH1A1 and assessed for ALDH1A1 knockdown by qRT-PCR analysis. (F–H) OVCAR5 cells were plated under low attachment conditions for six days; spheres were photographed (100× magnification, F); numbers of live cells were assessed by using the Cell-Titer Glo assay (G), and the numbers of sphere per well were counted (H). Bars represent averages of triplicate measurements; *** corresponds to p < 0.001; ** corresponds to p < 0.01; * corresponds to p < 0.05. (I) Percentage of ALDH+ cells in sh-Control or sh-ALDH1A1 transfected OVCAR3 cells. (J) OVCAR3 sh-Control and sh-ALDH1A1 were subcutaneously injected into the flanks of nude mice and tumor initiation was assessed; data captures the total number of tumors detectable at week #3 and at week #4. (K) Time to tumor initiation measured in days after subcutaneous injection of sh-Control and sh-ALDH1A1 transfected cells in the flanks of nude mice (n = 6 per group).

