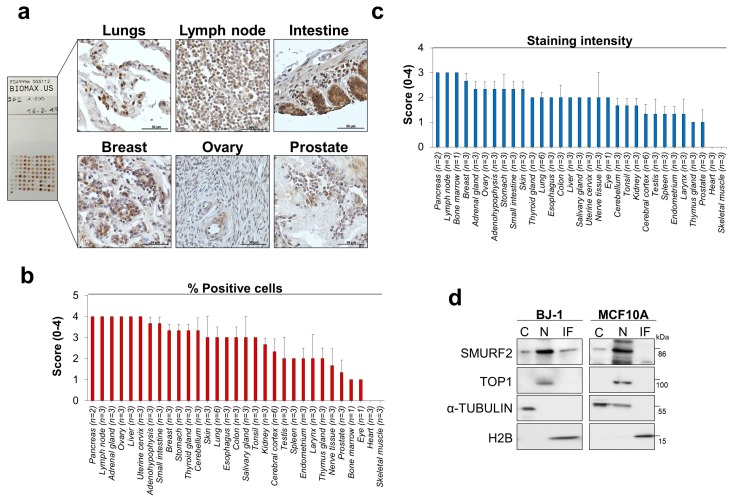
Figure 2.
SMURF2 protein expression and biodistribution in human normal tissues and untransformed cells. (a) IHC analysis of SMURF2 expression in a panel of human normal tissues (FDA999m TMA). These tissues were sampled on the same slide and processed for IHC simultaneously. Scale bars: 50 μm. (b,c) Quantification of the percentage of SMURF2 positive cells and staining intensity in FDA999m TMA. The following scoring system was used: 0 ≤ 10%; 1 = 10–24%; 2 = 25–49%; 3 = 50–74%; 4 = 75–100%. Data are presented as mean ± SEM. (d) Western blot analysis of subcellular fractions, in which cytosolic (C), nucleoplasmic (N), and insoluble fractions (IF) were extracted from non-tumorigenic BJ1-hTERT and MCF10A cells, showing predominant nuclear localization of SMURF2 in these cell models. Protein loadings and degree of fractionations are demonstrated by membrane probing with antibodies specific against the nuclear-sequestered topoisomerase 1 (TOP1), cytosolic α-TUBULIN, and a chromatin component histone H2B.

