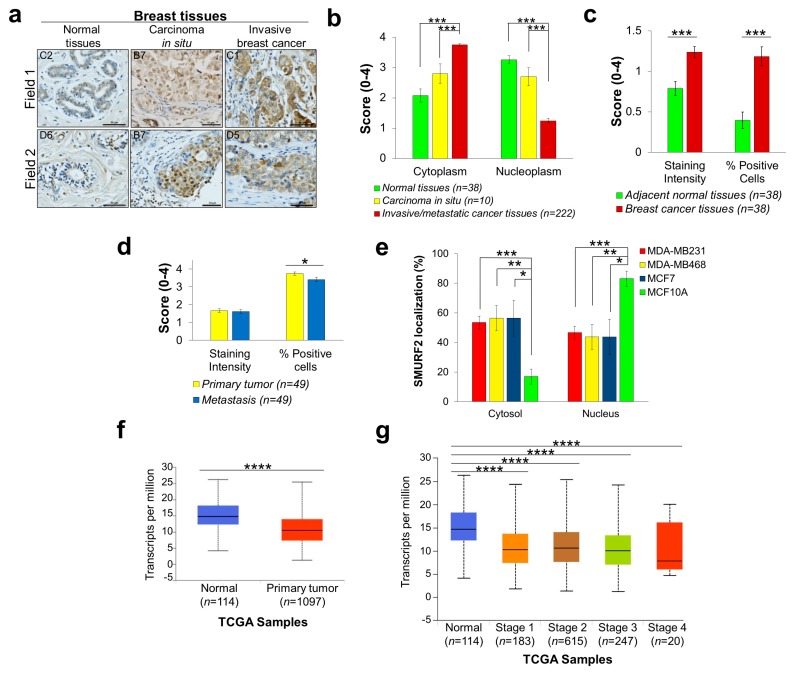
Figure 4.
Altered expression and biodistribution of SMURF2 in human breast carcinoma tissues and cell strains. (a) Representative images of IHC staining of SMURF2 in normal breast tissues, carcinoma in situ and invasive breast cancer, C1, C2, B7 (field 2), D5 and D6 samples are coordinates in BR804a TMA; B7 (field 1) is from BR10011a TMA. Scale bars, 50 μm. (b) Quantification of the IHC data on SMURF2 localization in human normal and BRCA clinical samples obtained in three TMAs: BR804a, BR10011a and BR10010c. Bars represent Mean ± SEM. *** p < 0.001. (c) Quantification of SMURF2 staining intensity and percentage of SMURF2-positive cells in BR804a TMA, containing primary breast carcinoma and adjacent normal tissues. Bars are Mean ± SEM. *** p < 0.001. (d) Quantification of SMURF2 staining intensity and percentage of positive cells in BR10010c, which incorporates invasive and matching metastatic tissues. Bars are Mean ± SEM. * p < 0.05. (e) Quantification of the data on SMURF2 subcellular localization in untransformed and BRCA cells obtained from five independent experiments (western blot analyses). Bars represent Mean ± SEM. * p < 0.05; ** p < 0.01; *** p < 0.001. (f,g) Boxplots showing relative expression of SMURF2 in normal and BRCA clinical samples. **** p < 0.0001.

