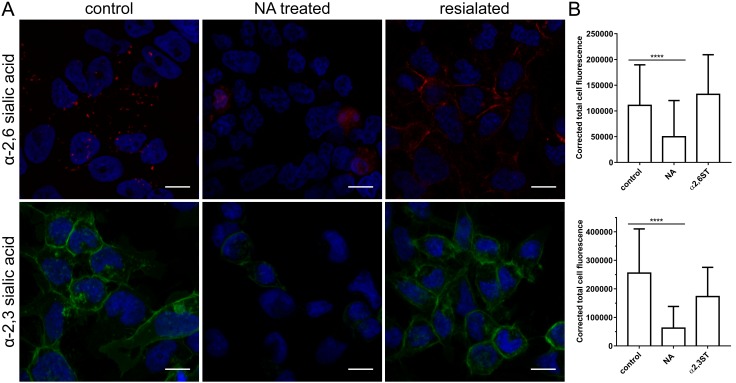
Figure 6.
Activity of neuraminidase and sialyltransferases. (A) HRT-18G cells were treated with type II neuraminidase (NA, 500 mU/mL) and overlaid with α-2,3-sialyltransferase (α2,3-ST) or α-2,6-sialyltransferase (α2,6-ST) in the presence of 1 mM cytidine-5′-monophospho-N-acetylneuraminic acid for 2 h at 37 °C. Following treatment, cells were fixed, and SAs were visualized with sambucus nigra lectin (α-2,3-SAs specific) labelled with fluorescein (in green) or maackia amurensis lectin (α-2,6-SAs specific) labelled with Cy3 (in red). Scale bar 10 µm. Data were collected from a minimum of 12 fields of view, from at least three different samples. (B) Graphs present corrected total cell fluorescence calculated by subtracting the product of multiplying the cell surface and the mean background fluorescence from total cell fluorescence. The data is presented as mean ± SD from at least one hundred cells per condition. (* p < 0.05; ** p < 0.01; *** p < 0.001; **** p < 0.0001).

