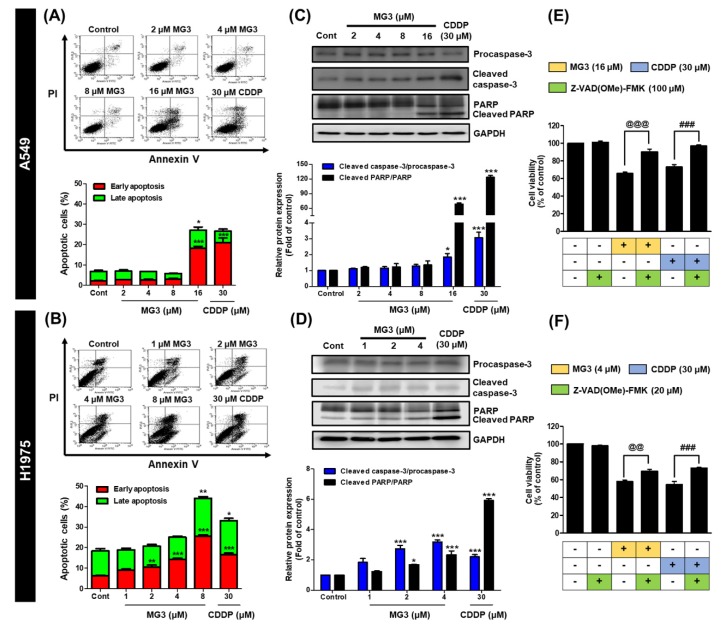
Figure 3.
Flow cytometric analysis of Annexin V/PI stained cells after MG3 and CDDP treatments for 24 h on (A) A549 and (B) H1975 cells. Western blot analysis of apoptotic markers, caspase-3 and PARP, for (C) A549 and (D) H1975 cells. Inhibition of MG3-induced apoptosis by the pan caspase inhibitor Z-VAD(OMe)-FMK in (E) A549 and (F) H1975 cells. Data are expressed as mean ± SEM (n = 3). * p ≤ 0.05, ** p ≤ 0.01, and *** p ≤ 0.001 vs. control. @ p ≤ 0.05, @@ p ≤ 0.01, and @@@ p ≤ 0.001 vs. MG3. # p ≤ 0.05, ## p ≤ 0.01, and ### p ≤ 0.001 vs. CDDP.

