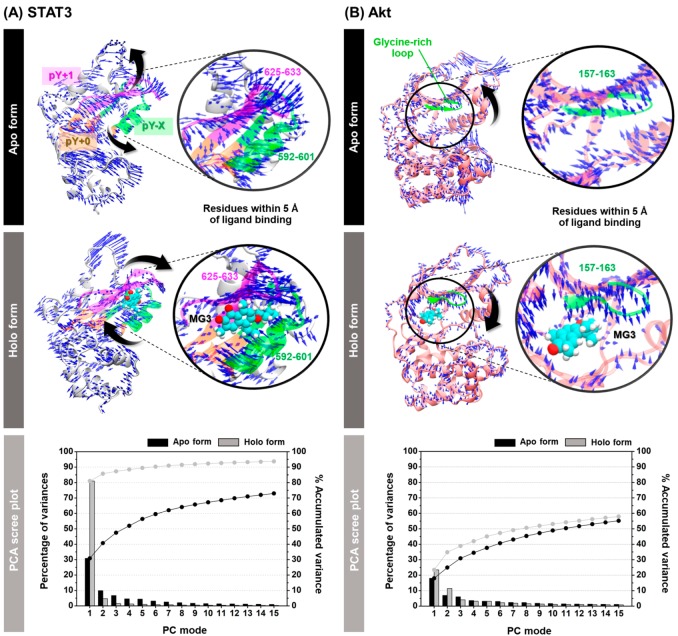
Figure 6.
Porcupine plot of apo and holo forms of (A) STAT3 and (B) Akt across the PC1. The residues within 5 Å of ligand are presented in circle where the MG3 molecule is shown in vdW model. The PCA scree plot of quantitative characters for each protein is given below, in which the columns in black and grey represent the data for apo and holo forms, respectively.

